> ## Documentation Index
> Fetch the complete documentation index at: https://docs.adopt.ai/llms.txt
> Use this file to discover all available pages before exploring further.
# Usage and reporting
> The org-wide views into what's running, what's pending review, and how much is being consumed.
Admins get a view across the whole org — not just their own queue — which is where you spot bottlenecks and manage cost.
## The Runs view
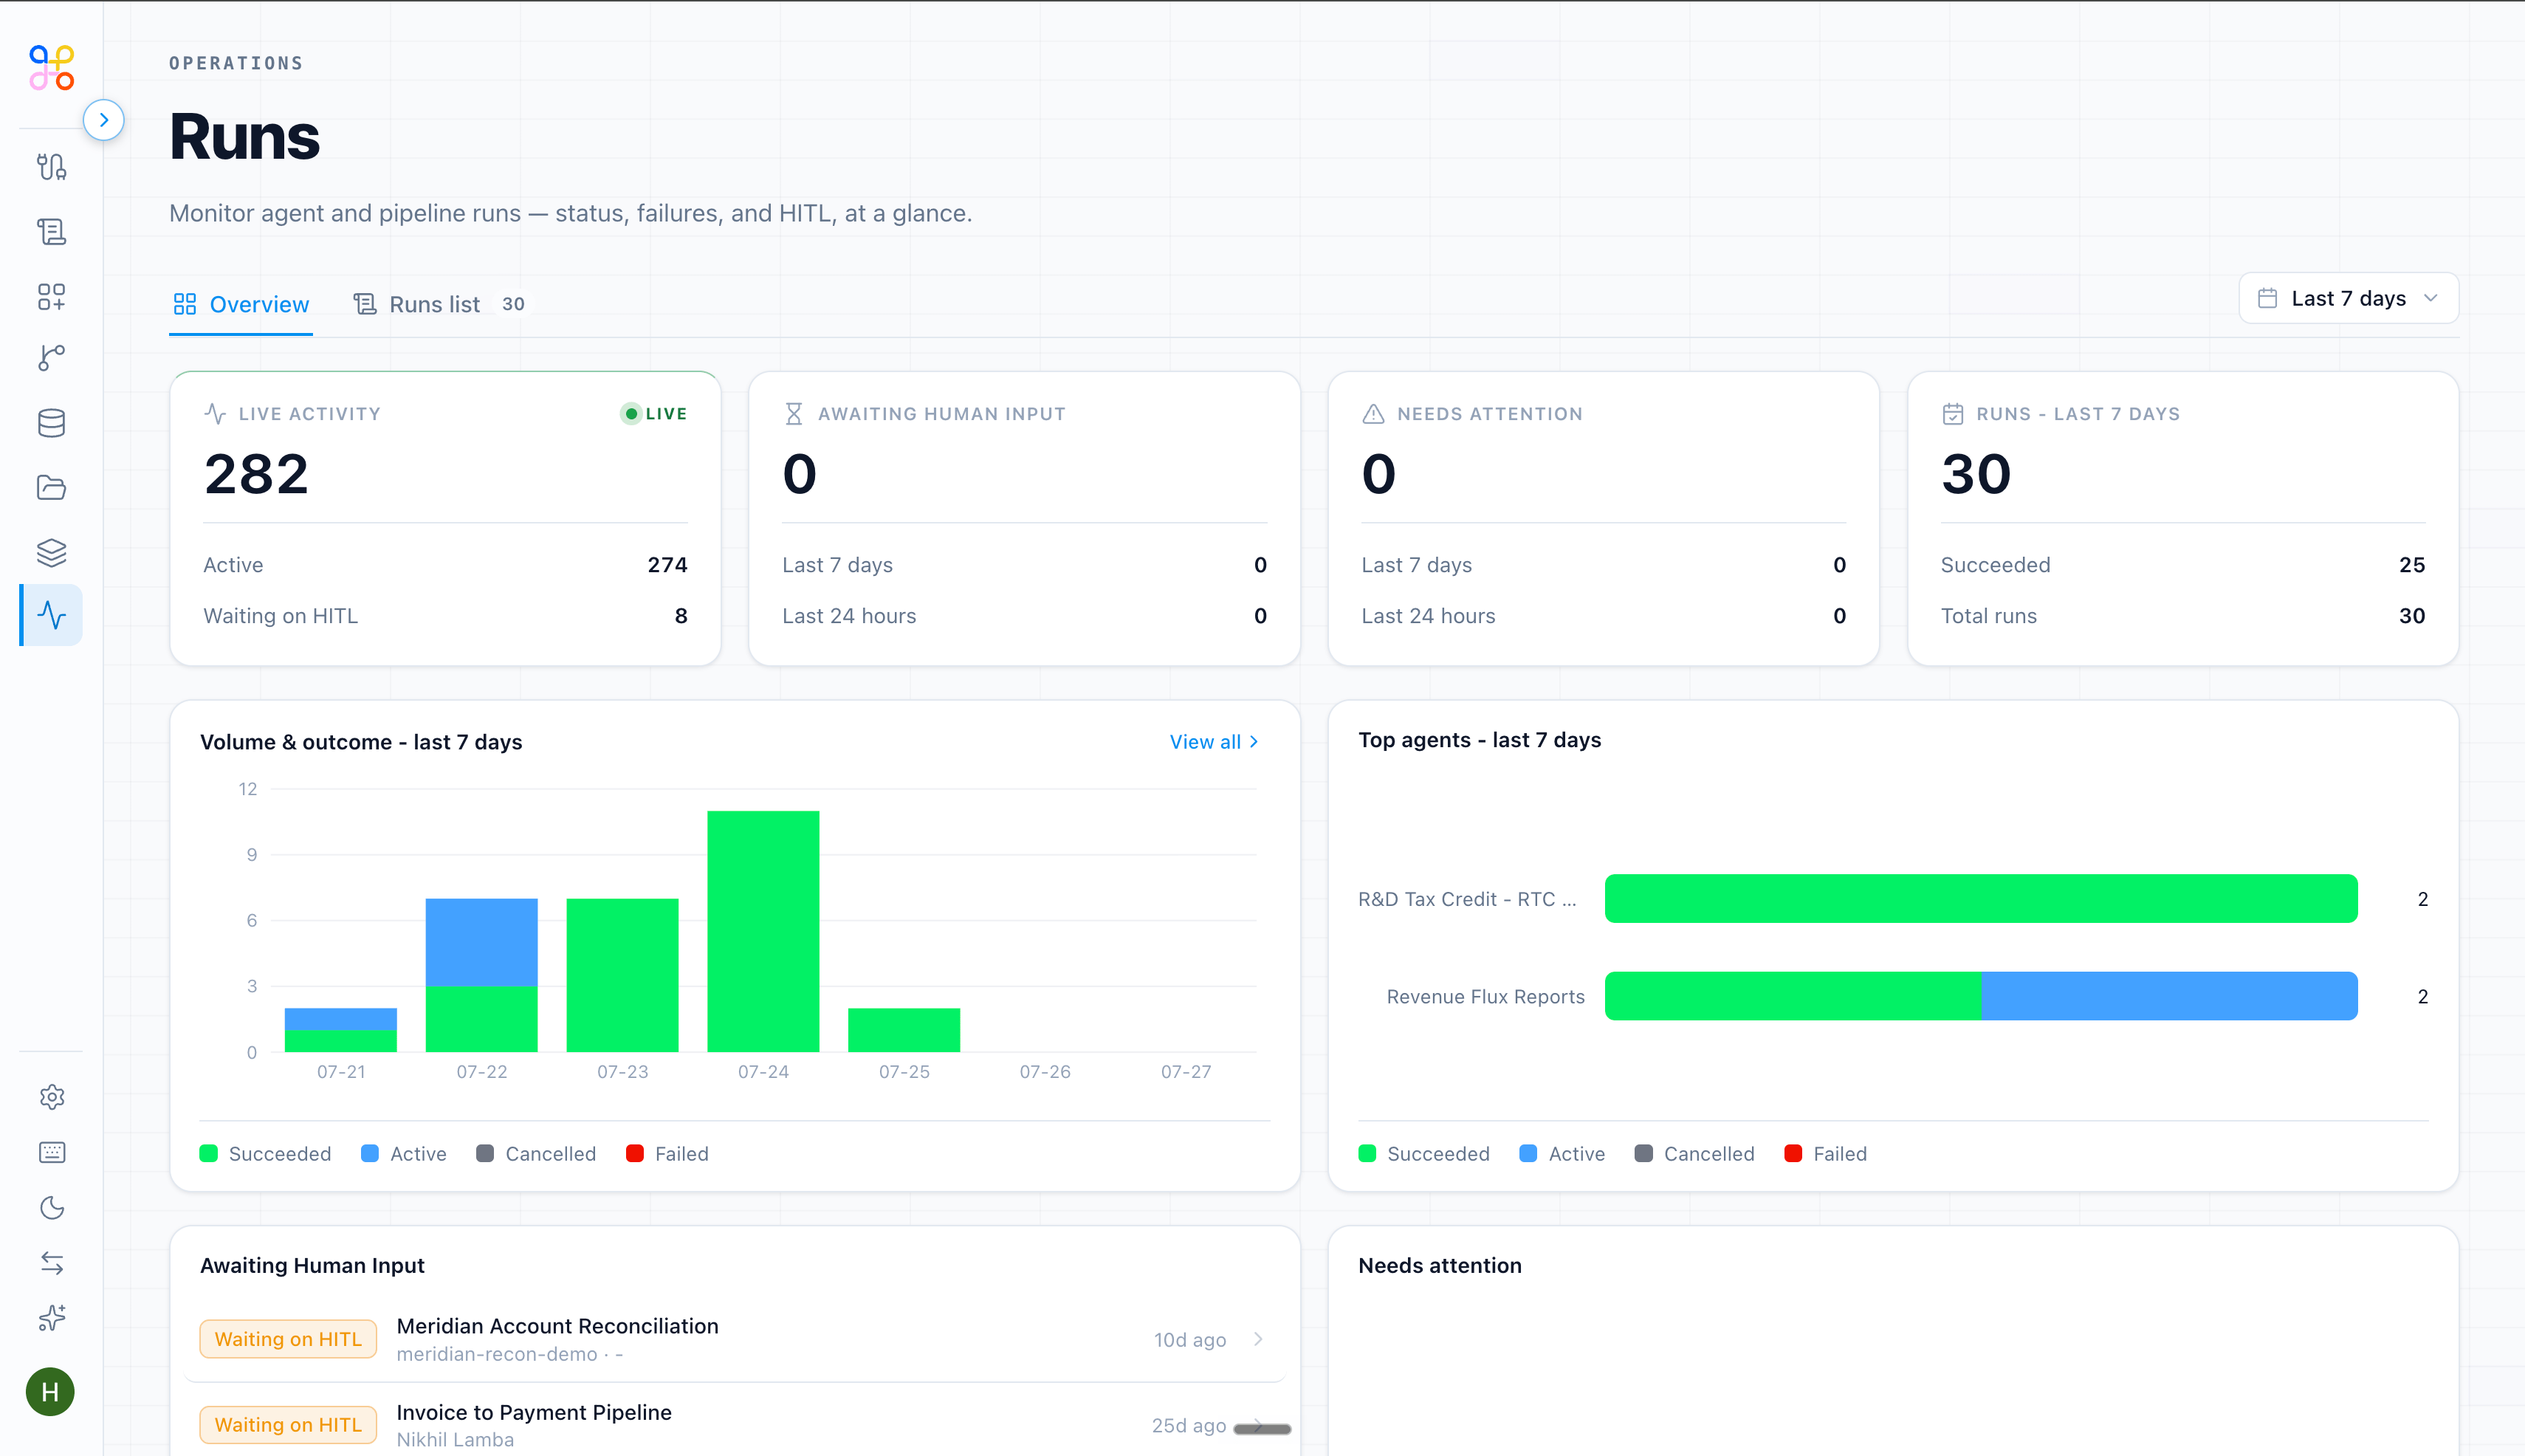
The **Runs** view is the org-wide monitor for agent and pipeline runs — status, failures, and HITL, at a glance.
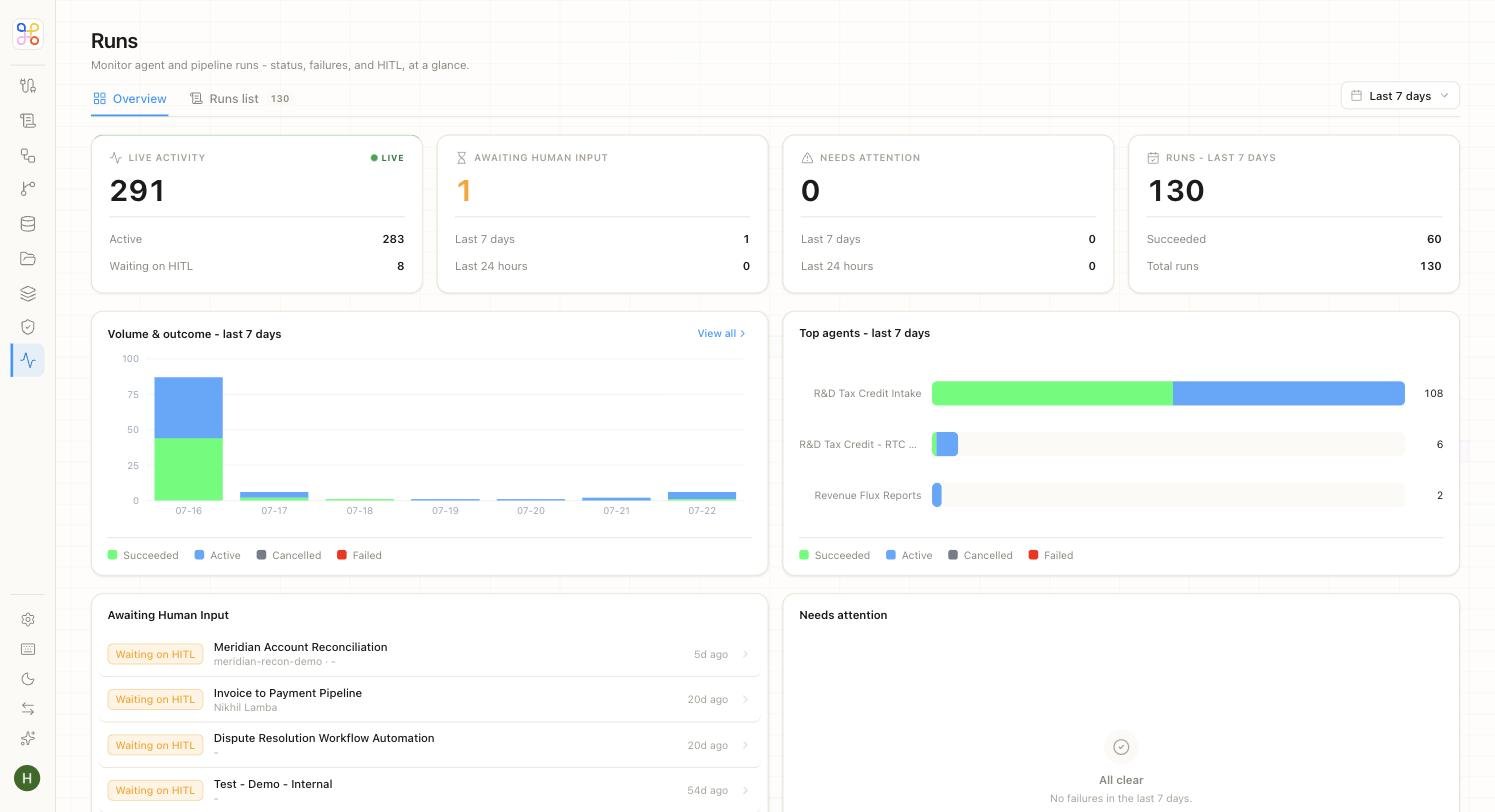
 At the top you get the numbers that matter day to day:
* **Live activity** — how many runs are active right now, and how many are waiting on HITL review.
* **Awaiting human input** — work paused for a reviewer, over the last 7 days and 24 hours.
* **Needs attention** — failures that need looking at.
* **Runs (last 7 days)** — total and succeeded.
Below that, a **volume & outcome** chart (succeeded / active / cancelled / failed over time) and **top agents** by run count, plus a live list of runs **awaiting human input** so you can see exactly where work is stuck.
## Reporting
Reporting breaks down by process and by agent, so you can answer questions like *"how much R\&D work ran this quarter, and how much needed rework."* End users also get a self-service view of their own usage on [their dashboard](/end-user-guide/your-dashboard).
## Using the data
* If **awaiting human input** is growing, reviewers are the constraint — add or reassign them.
* If a specific agent shows a high failure rate, investigate its data source and instructions (see [When a run fails](/troubleshooting/when-a-run-fails)).
* Use token trends to decide where BYOK or open-weight models would pay off (see [Billing and credits](/admin/billing-and-credits)).
## Next steps
1. [Your dashboard](/end-user-guide/your-dashboard)
2. [Billing and credits](/admin/billing-and-credits)
3. [When a run fails](/troubleshooting/when-a-run-fails)
At the top you get the numbers that matter day to day:
* **Live activity** — how many runs are active right now, and how many are waiting on HITL review.
* **Awaiting human input** — work paused for a reviewer, over the last 7 days and 24 hours.
* **Needs attention** — failures that need looking at.
* **Runs (last 7 days)** — total and succeeded.
Below that, a **volume & outcome** chart (succeeded / active / cancelled / failed over time) and **top agents** by run count, plus a live list of runs **awaiting human input** so you can see exactly where work is stuck.
## Reporting
Reporting breaks down by process and by agent, so you can answer questions like *"how much R\&D work ran this quarter, and how much needed rework."* End users also get a self-service view of their own usage on [their dashboard](/end-user-guide/your-dashboard).
## Using the data
* If **awaiting human input** is growing, reviewers are the constraint — add or reassign them.
* If a specific agent shows a high failure rate, investigate its data source and instructions (see [When a run fails](/troubleshooting/when-a-run-fails)).
* Use token trends to decide where BYOK or open-weight models would pay off (see [Billing and credits](/admin/billing-and-credits)).
## Next steps
1. [Your dashboard](/end-user-guide/your-dashboard)
2. [Billing and credits](/admin/billing-and-credits)
3. [When a run fails](/troubleshooting/when-a-run-fails)