> ## Documentation Index
> Fetch the complete documentation index at: https://docs.adopt.ai/llms.txt
> Use this file to discover all available pages before exploring further.
# Creating a New Experience
> Walk through the full creation flow — from blank canvas to a named, multi-page Experience ready to build on.
Creating an Experience starts with a single click and gives you two clear paths forward: describe what you want to the AI Builder and let it generate a starting layout, or pick from a library of pre-built templates and customize from there. Either way, you'll have something on the canvas in under a minute.
## Starting a New Experience
From the [Experience dashboard](/essentials/getting-started-with-experiences), click `+ New Experience` in the top right corner.
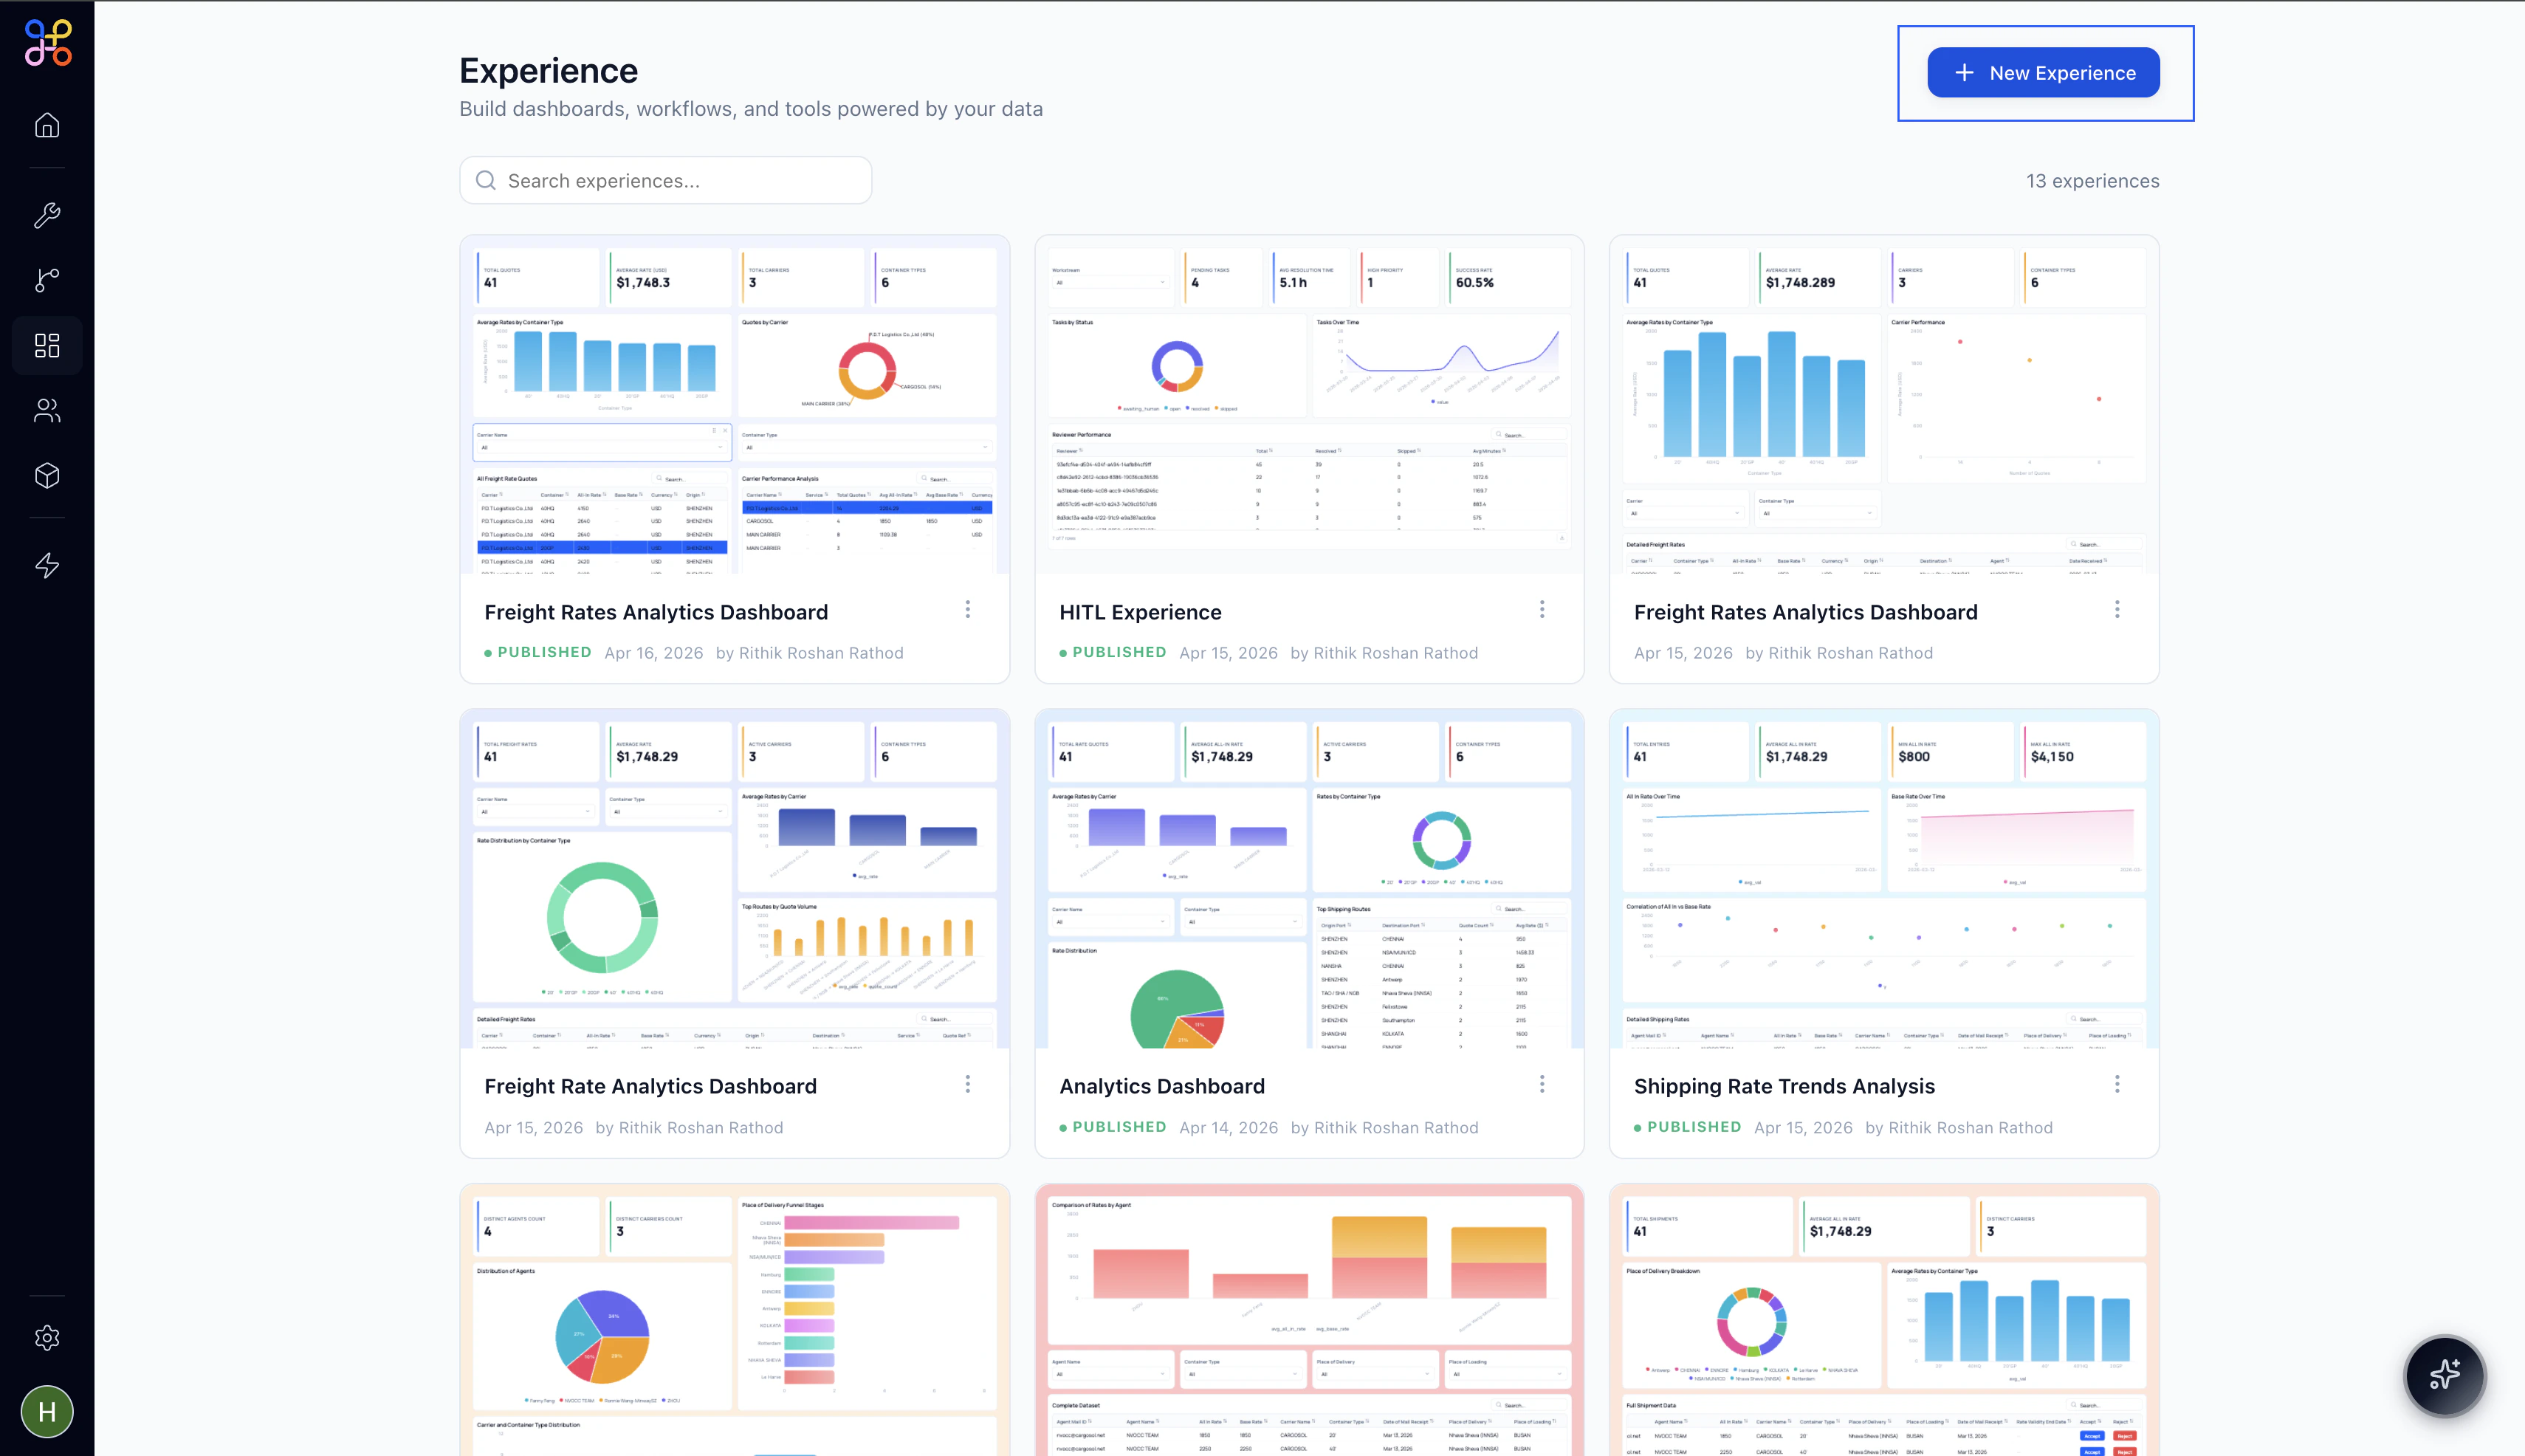 You're immediately taken into the Experience Builder with an empty canvas. The Experience is created in **Draft** state and titled **Untitled Experience** by default.
## Naming Your Experience
Click directly on **Untitled Experience** in the top bar to rename it. The title becomes an editable text field — type your name and press `Enter` or click away to save.
You're immediately taken into the Experience Builder with an empty canvas. The Experience is created in **Draft** state and titled **Untitled Experience** by default.
## Naming Your Experience
Click directly on **Untitled Experience** in the top bar to rename it. The title becomes an editable text field — type your name and press `Enter` or click away to save.
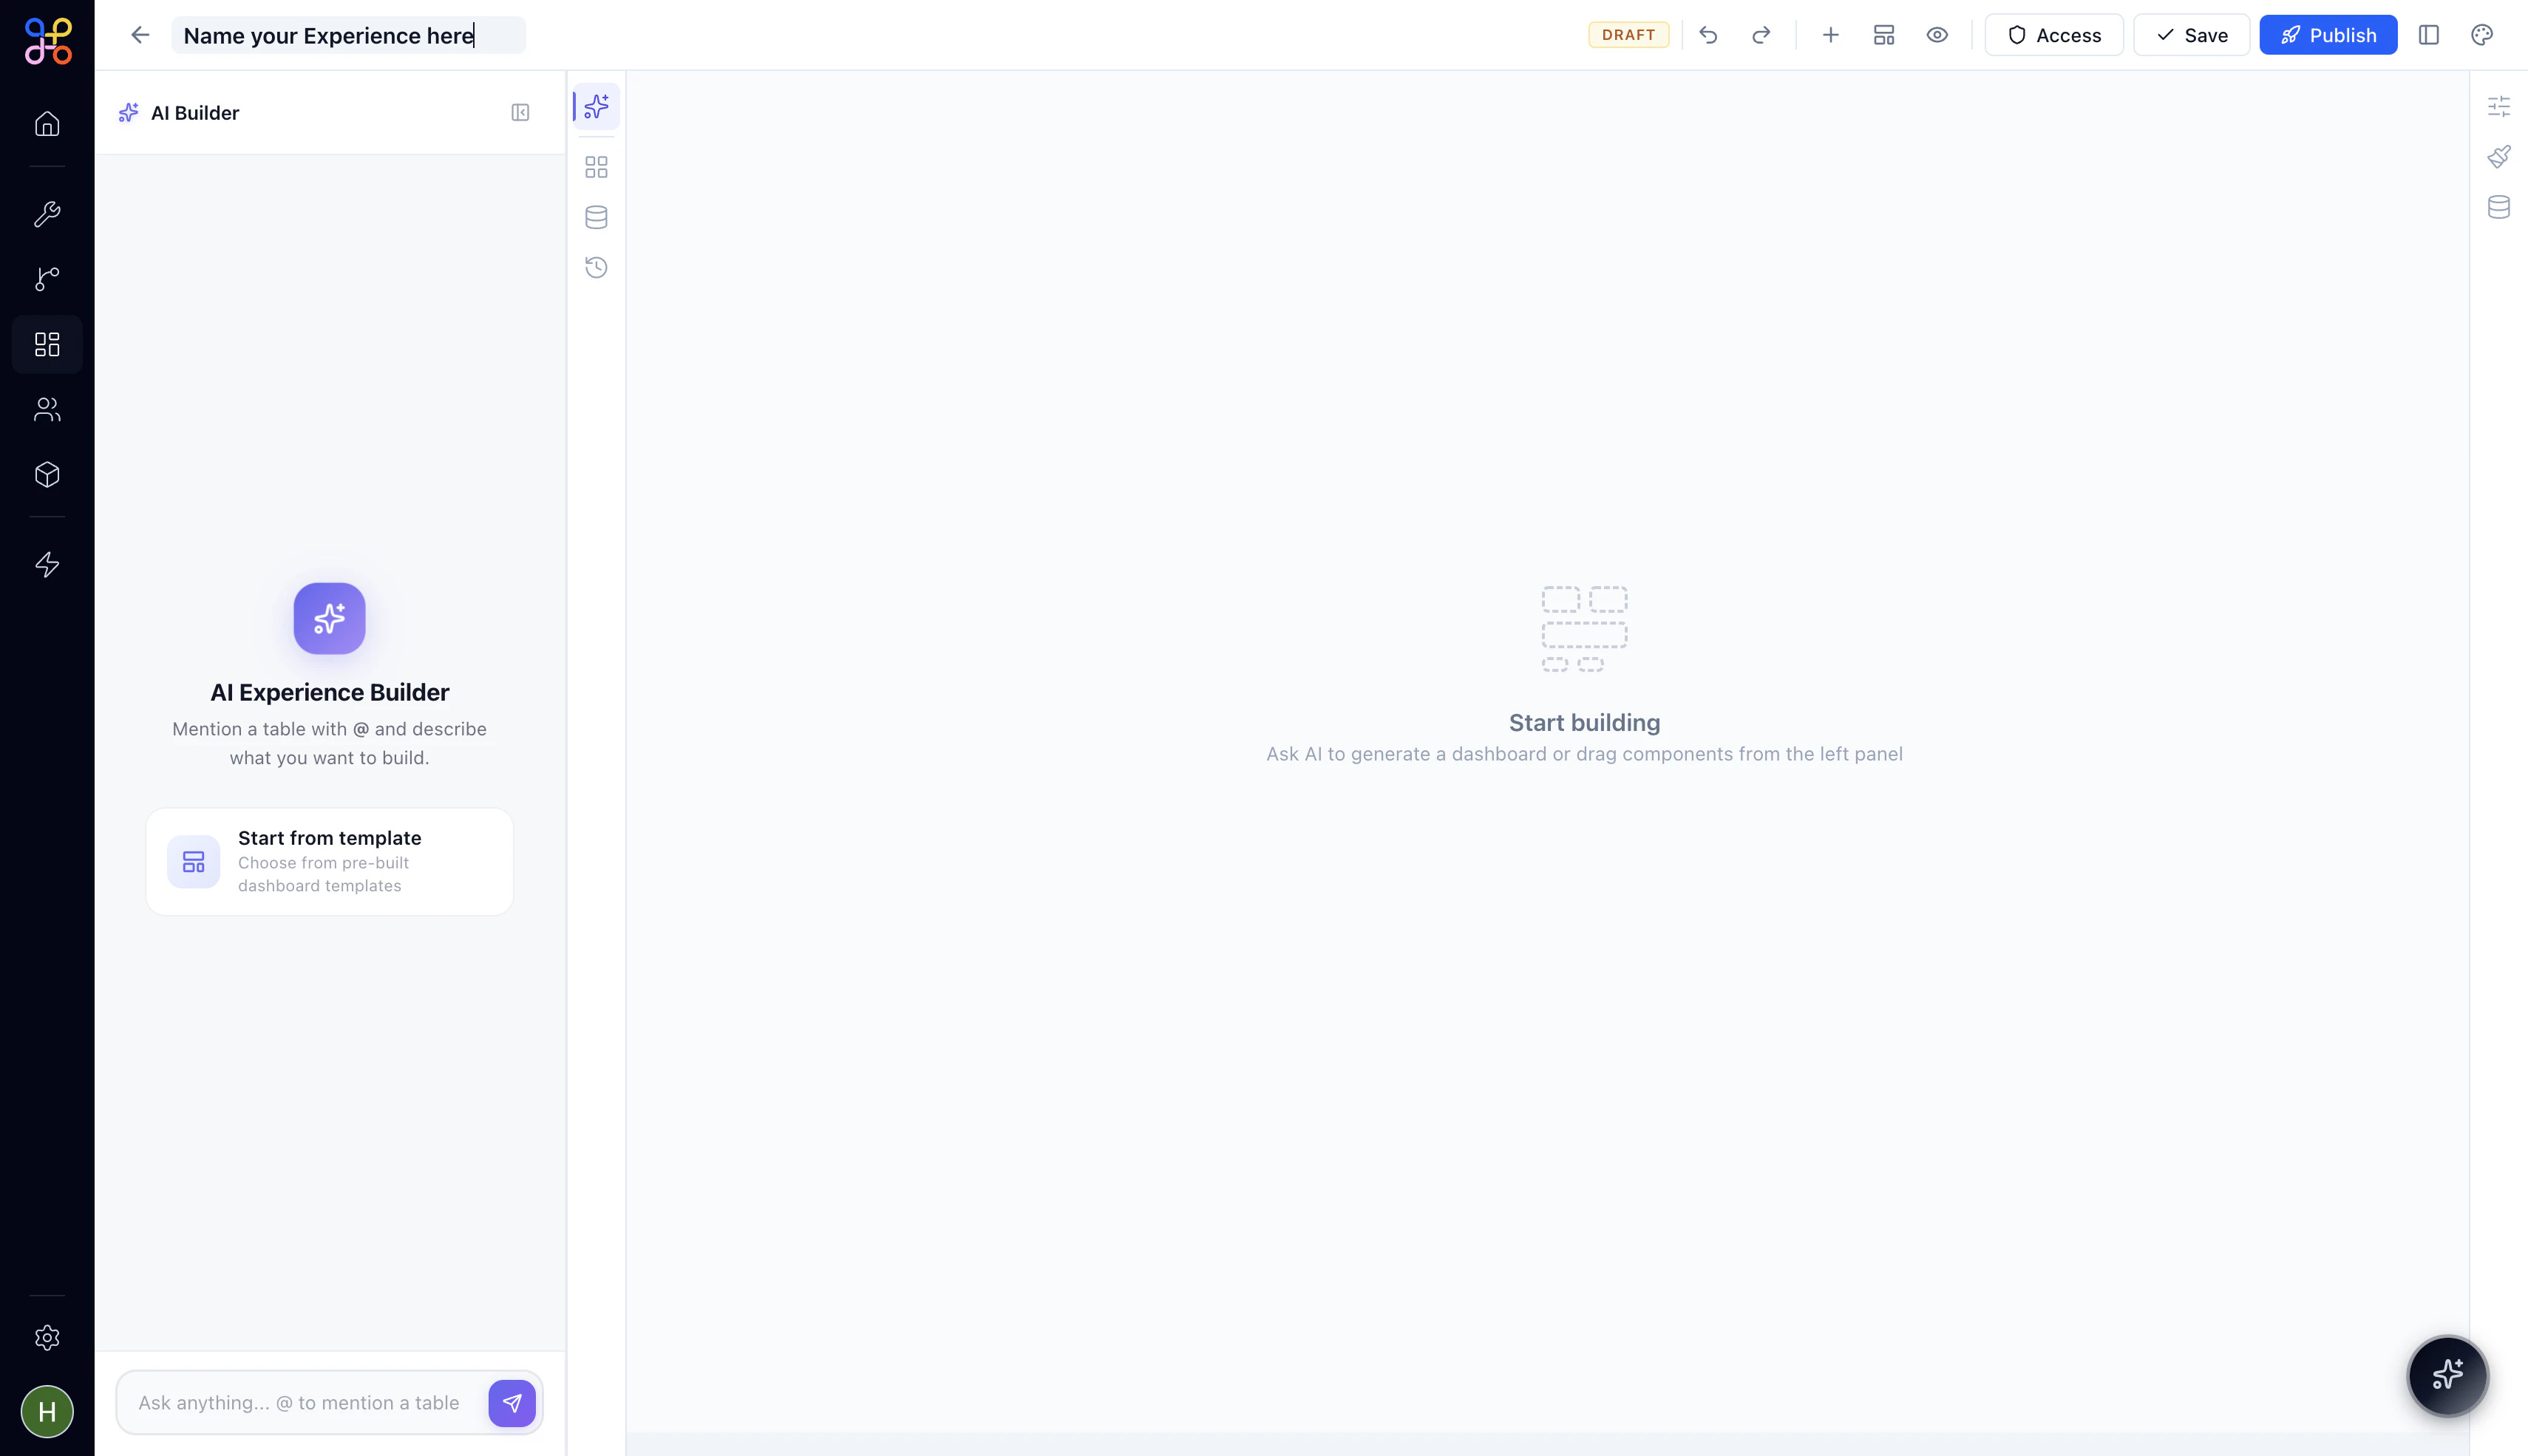 Name your Experience after the audience and purpose, not just the data. "Freight Ops Review Board" is more useful to teammates than "Freight Dashboard v2".
## Choosing How to Build
A new Experience opens with the **AI Builder** panel active on the left. You have two starting options:
The AI Builder lets you describe what you want in plain language and generates a starter layout for you. Mention a data table using `@` to give the AI context about your data, then describe the dashboard or tool you want to create.
For example:
```text wrap theme={null}
Build a HITL review dashboard with KPI cards for pending and resolved tasks, a donut chart by status, and a task list grouped by workflow.
```
The AI generates widgets, lays them out on the canvas, and connects them to the table you referenced. You can then refine from there — edit any widget, add new ones, or restructure the layout.
**Best for:**
* Quickly scaffolding a layout when you have a clear idea of what you need
* Exploring what's possible with a particular dataset
* Getting 80% of the way there fast, then fine-tuning manually
Templates are pre-built Experience layouts you can use as a starting point. Click **Start from template** in the AI Builder panel to open the template picker.
Name your Experience after the audience and purpose, not just the data. "Freight Ops Review Board" is more useful to teammates than "Freight Dashboard v2".
## Choosing How to Build
A new Experience opens with the **AI Builder** panel active on the left. You have two starting options:
The AI Builder lets you describe what you want in plain language and generates a starter layout for you. Mention a data table using `@` to give the AI context about your data, then describe the dashboard or tool you want to create.
For example:
```text wrap theme={null}
Build a HITL review dashboard with KPI cards for pending and resolved tasks, a donut chart by status, and a task list grouped by workflow.
```
The AI generates widgets, lays them out on the canvas, and connects them to the table you referenced. You can then refine from there — edit any widget, add new ones, or restructure the layout.
**Best for:**
* Quickly scaffolding a layout when you have a clear idea of what you need
* Exploring what's possible with a particular dataset
* Getting 80% of the way there fast, then fine-tuning manually
Templates are pre-built Experience layouts you can use as a starting point. Click **Start from template** in the AI Builder panel to open the template picker.
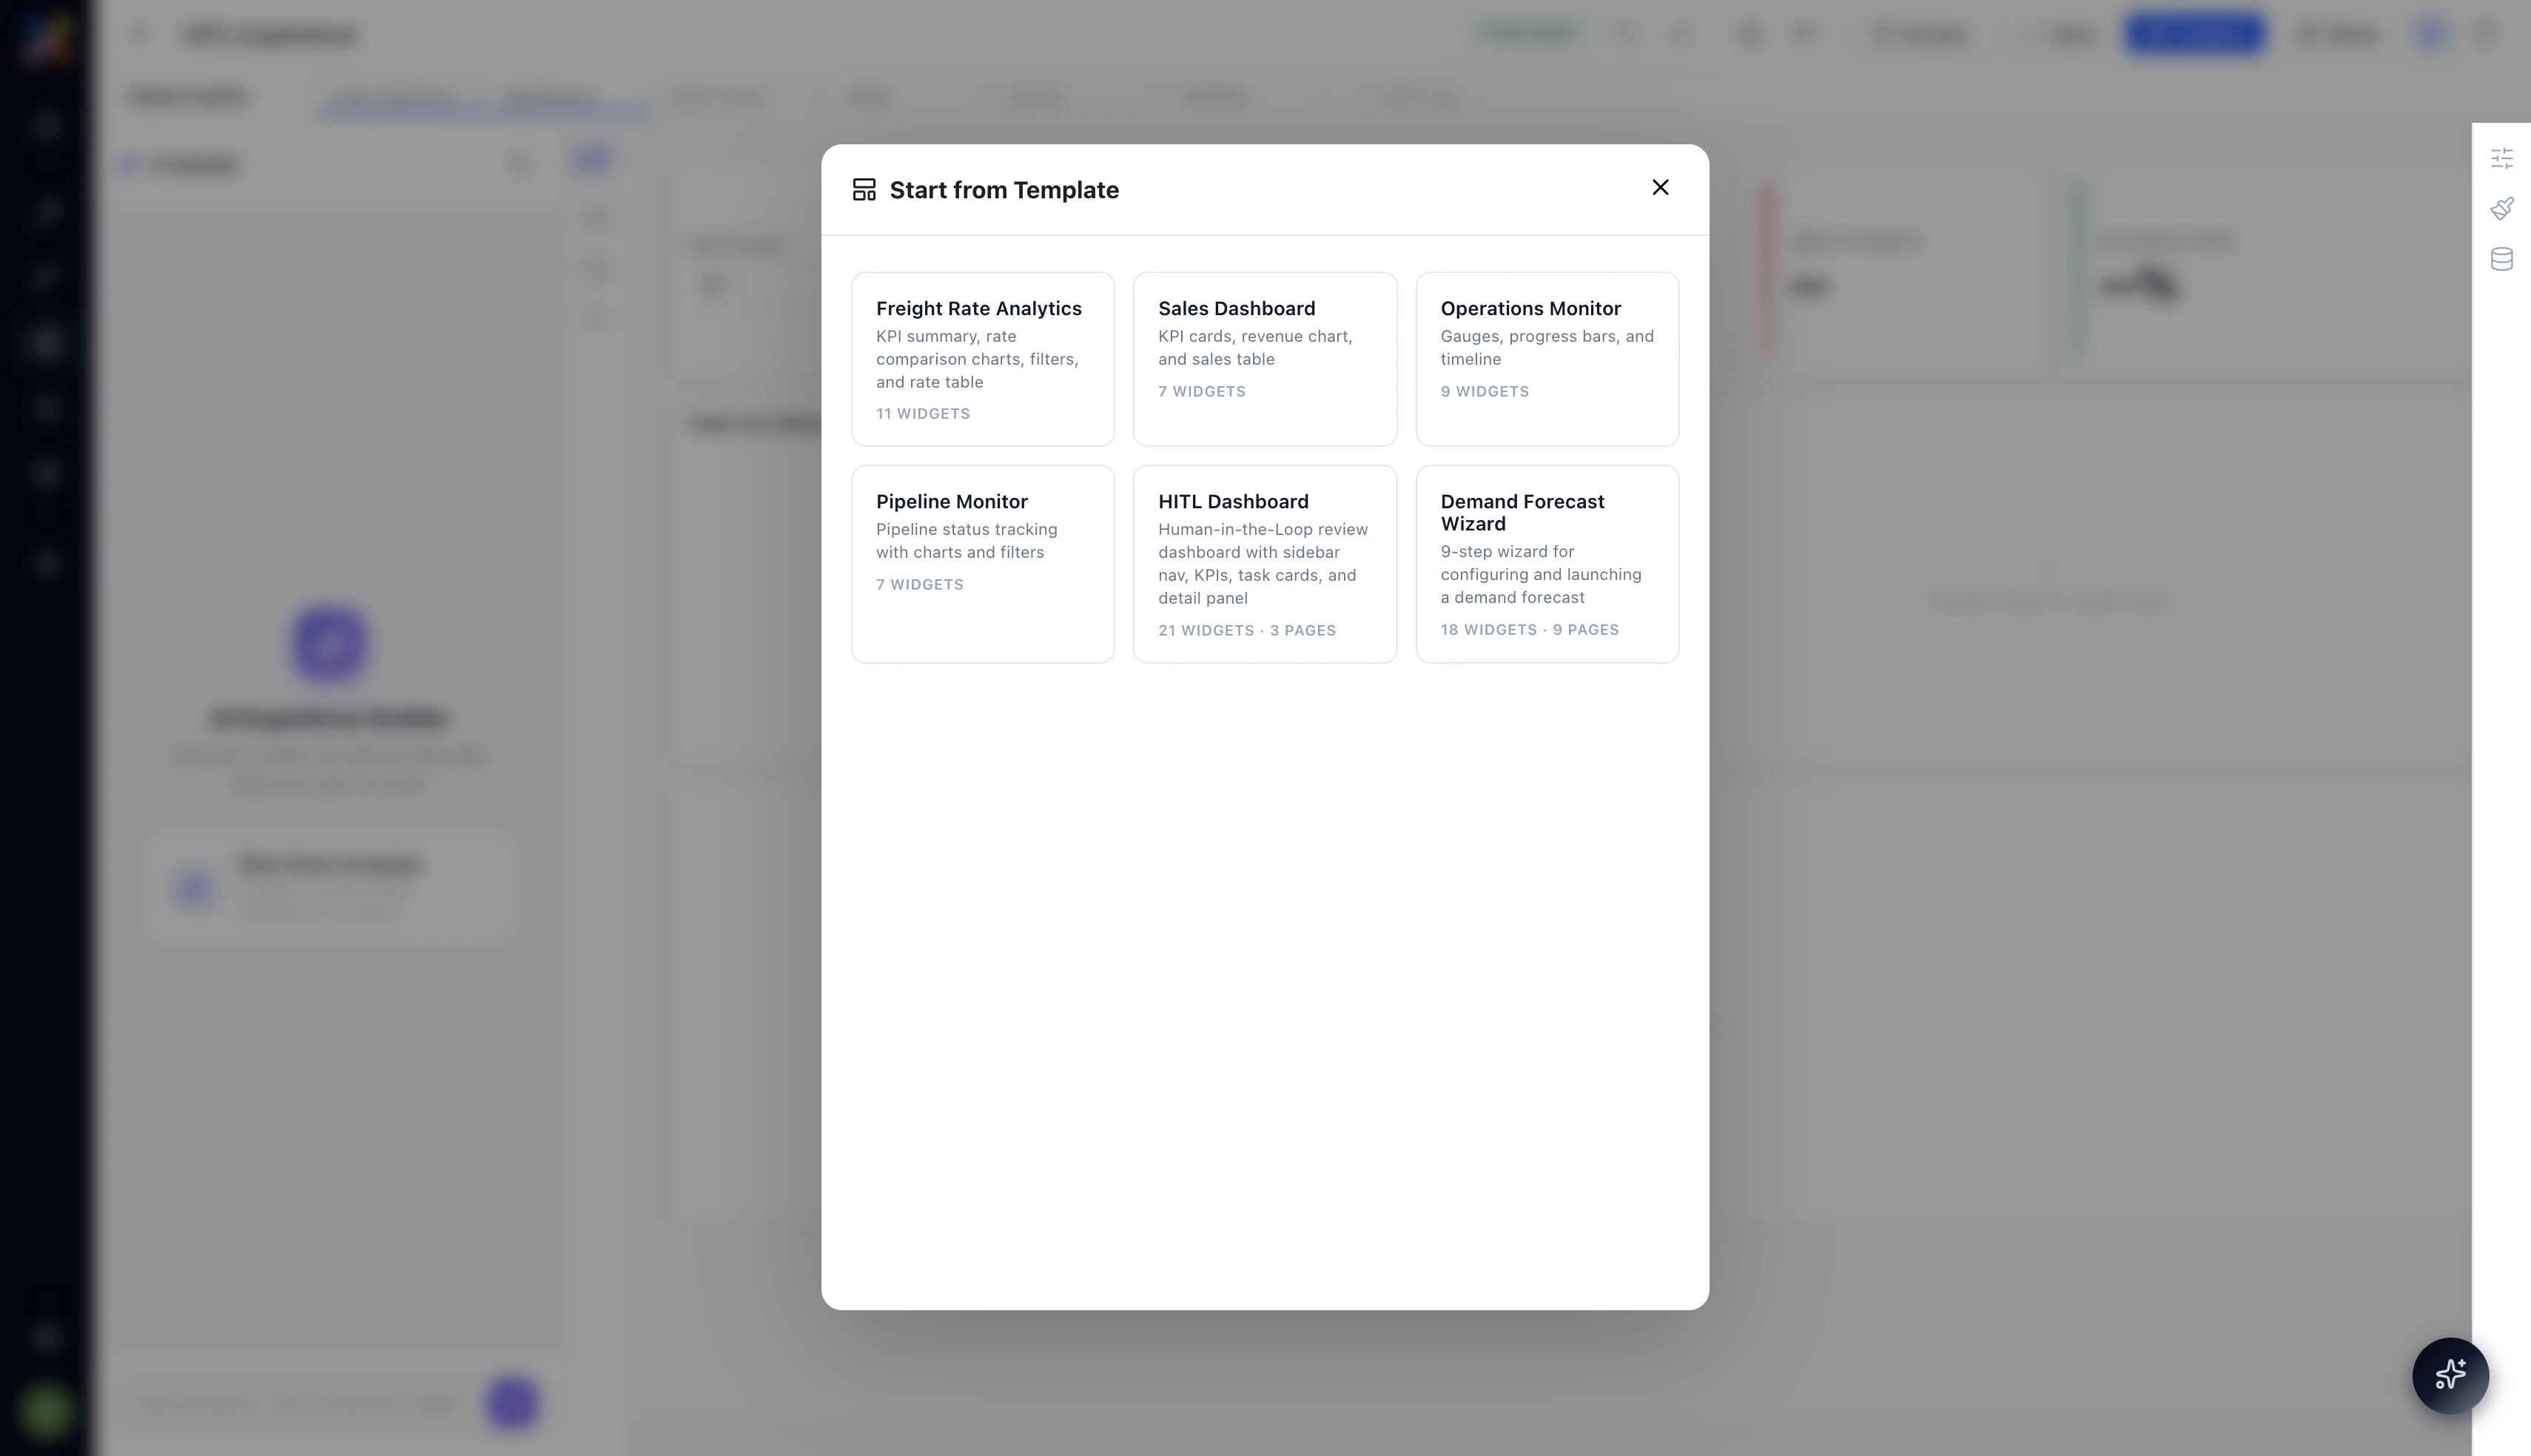 Six templates are available:
| Template | What it includes |
| -------------------------- | -------------------------------------------------------------------------------------------------------------- |
| **Freight Rate Analytics** | KPI summary, rate comparison charts, filters, and rate table — 11 widgets |
| **Sales Dashboard** | KPI cards, revenue chart, and sales table — 7 widgets |
| **Operations Monitor** | Gauges, progress bars, and timeline — 9 widgets |
| **Pipeline Monitor** | Pipeline status tracking with charts and filters — 7 widgets |
| **HITL Dashboard** | Human-in-the-Loop review dashboard with sidebar nav, KPIs, task cards, and detail panel — 18 widgets · 3 pages |
| **Demand Forecast Wizard** | 9-step wizard for configuring and launching a demand forecast — 18 widgets · 9 pages |
Click any template to apply it to your canvas. All widgets will be placed and wired to placeholder data sources — you then connect them to your actual Pipeline Outcomes.
**Best for:**
* Getting a proven layout structure for a known use case
* Multi-page Experiences (HITL Dashboard and Demand Forecast Wizard come with full page structures already set up)
* Teams that want a consistent look and feel across multiple Experiences
## Managing Pages
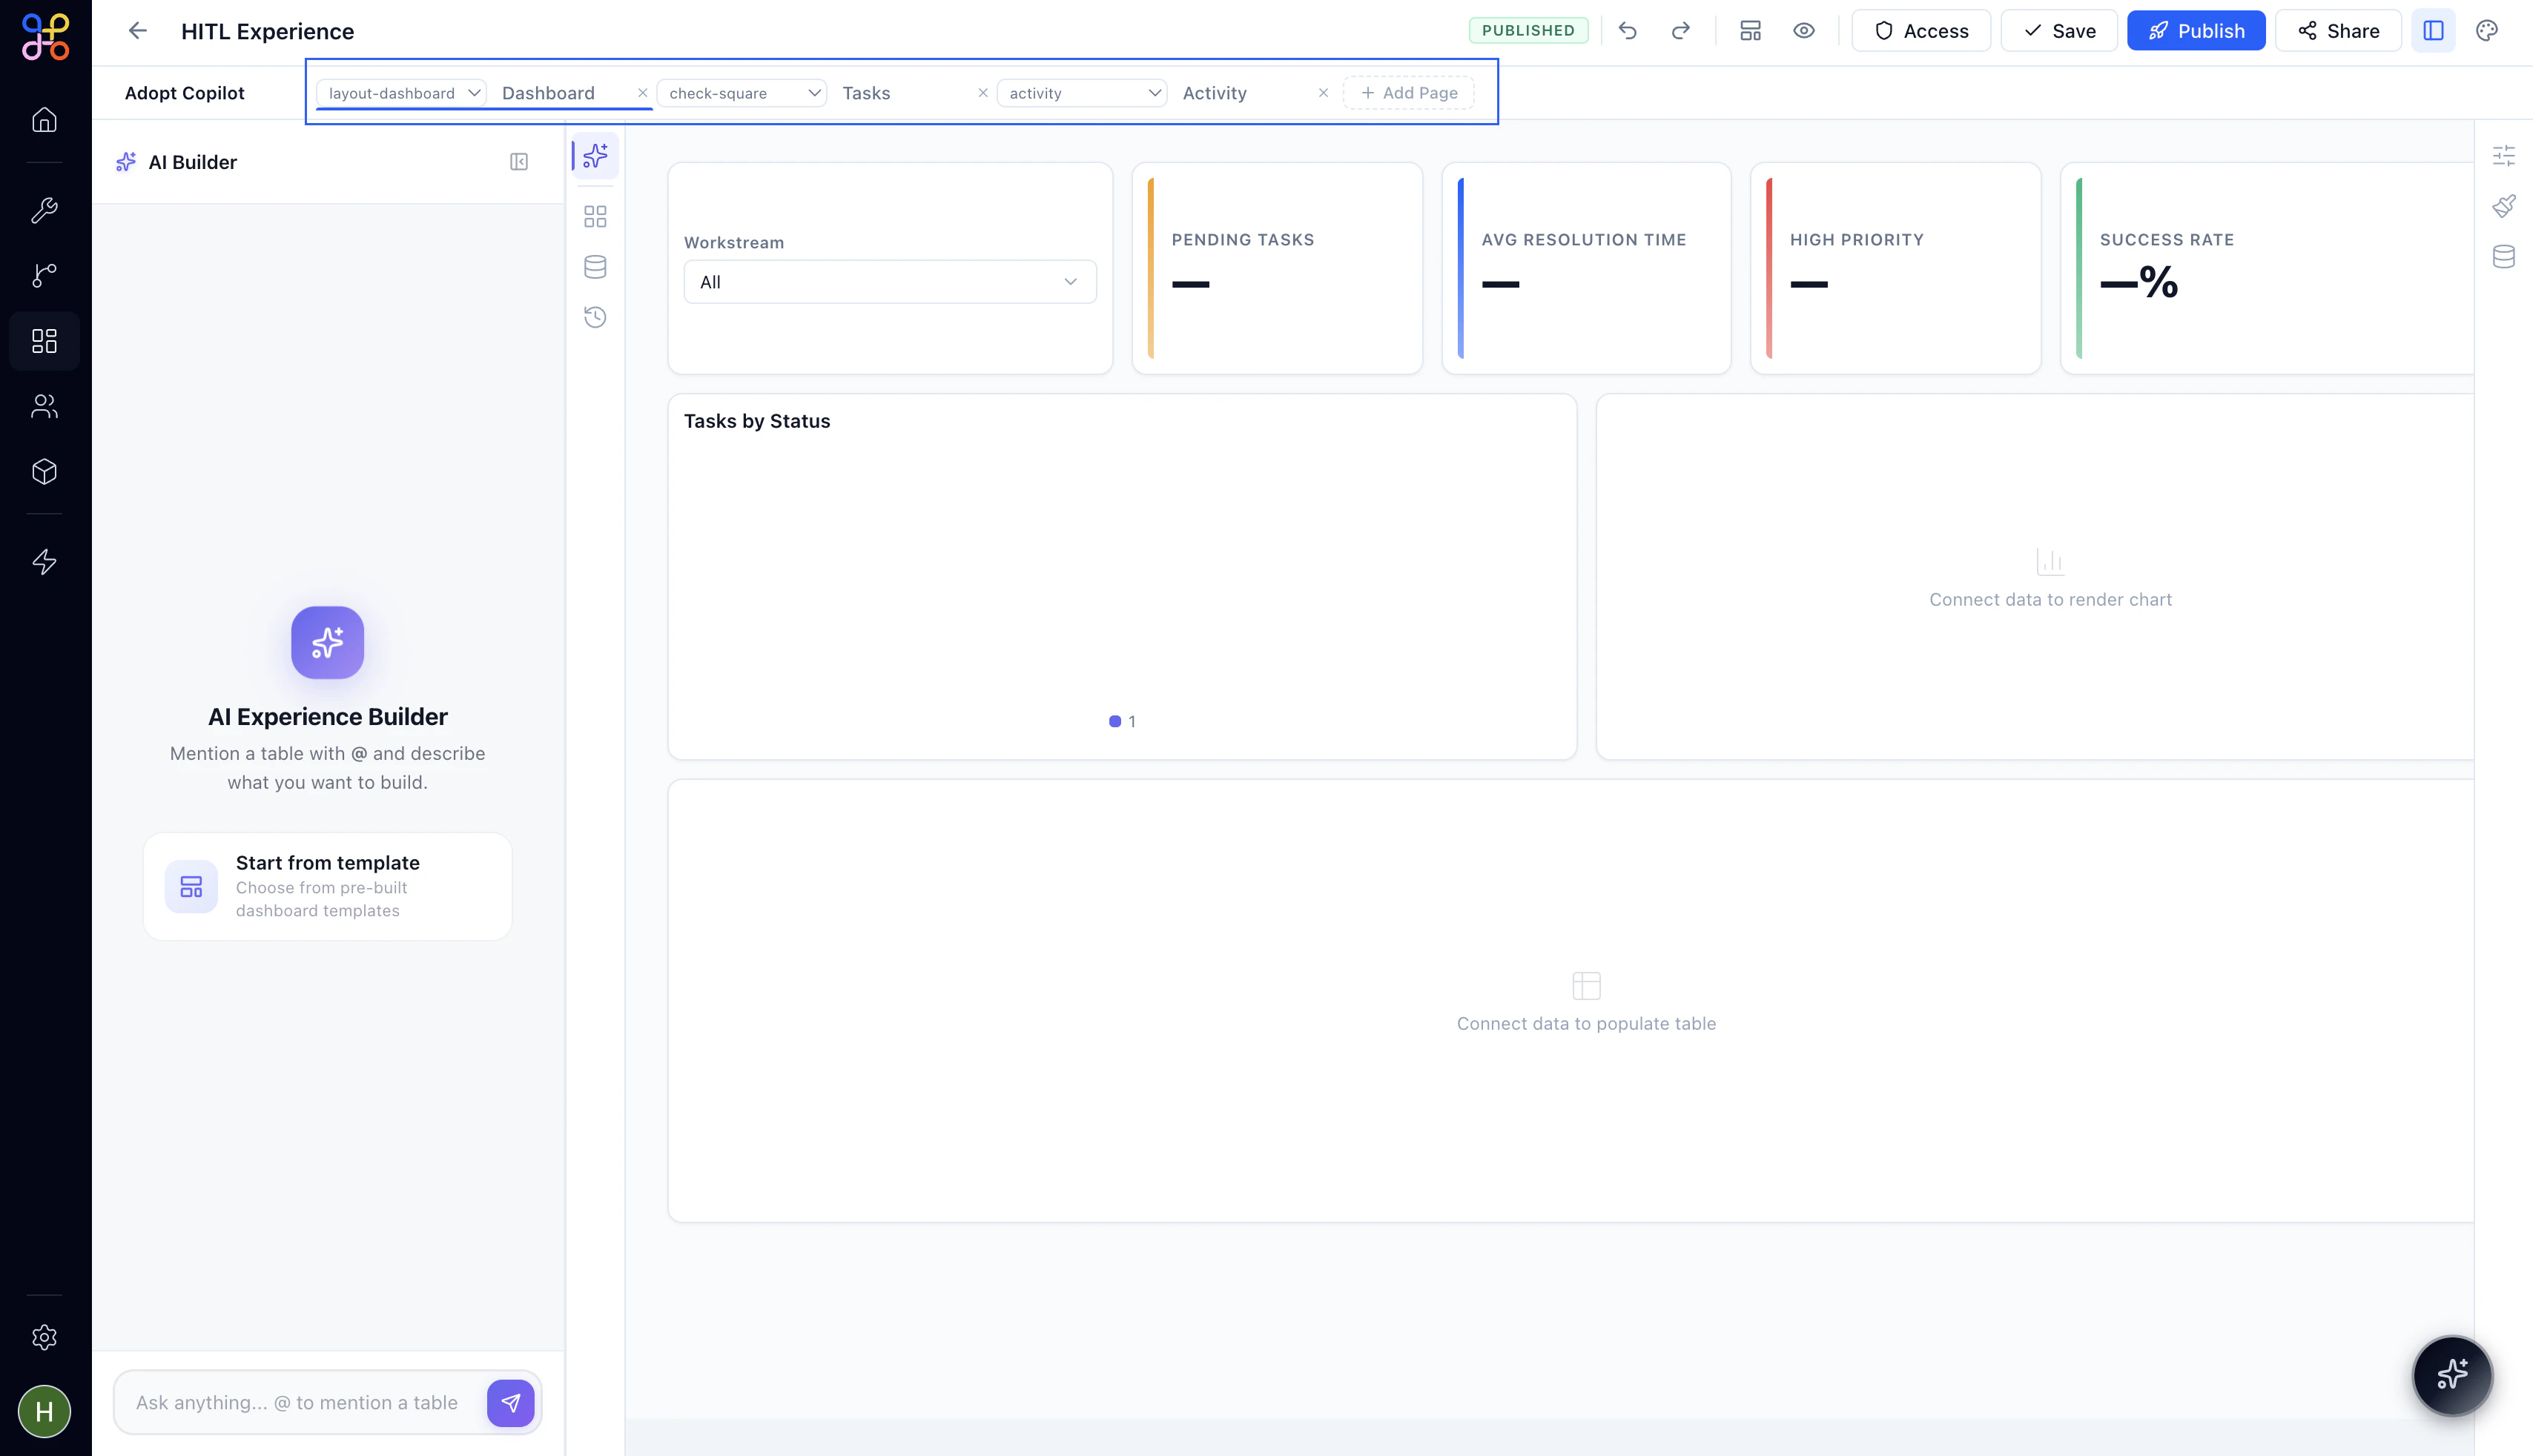
Every Experience can have multiple pages — each page is a separate view accessible from the left nav in the published Experience. Pages appear as tabs along the top of the builder canvas.
Six templates are available:
| Template | What it includes |
| -------------------------- | -------------------------------------------------------------------------------------------------------------- |
| **Freight Rate Analytics** | KPI summary, rate comparison charts, filters, and rate table — 11 widgets |
| **Sales Dashboard** | KPI cards, revenue chart, and sales table — 7 widgets |
| **Operations Monitor** | Gauges, progress bars, and timeline — 9 widgets |
| **Pipeline Monitor** | Pipeline status tracking with charts and filters — 7 widgets |
| **HITL Dashboard** | Human-in-the-Loop review dashboard with sidebar nav, KPIs, task cards, and detail panel — 18 widgets · 3 pages |
| **Demand Forecast Wizard** | 9-step wizard for configuring and launching a demand forecast — 18 widgets · 9 pages |
Click any template to apply it to your canvas. All widgets will be placed and wired to placeholder data sources — you then connect them to your actual Pipeline Outcomes.
**Best for:**
* Getting a proven layout structure for a known use case
* Multi-page Experiences (HITL Dashboard and Demand Forecast Wizard come with full page structures already set up)
* Teams that want a consistent look and feel across multiple Experiences
## Managing Pages
Every Experience can have multiple pages — each page is a separate view accessible from the left nav in the published Experience. Pages appear as tabs along the top of the builder canvas.
 ### Adding a Page
Click `+ Add Page` at the end of the page tab row to create a new blank page. Give it a name — this becomes the label shown in the Experience's left nav when published.
### Setting a Page Icon
Each page tab has an icon type dropdown to the left of the page name. Click the dropdown to choose the icon that appears next to the page name in the published nav. Icon types map to common page purposes — dashboard layouts, task views, activity feeds, and more.
### Reordering and Removing Pages
Drag page tabs left or right to reorder them. To remove a page, click the `×` on its tab. The first page in the tab order becomes the default landing page when someone opens the Experience.
Removing a page deletes all the widgets and data queries on that page. This action cannot be undone — make sure you don't need any of that content before removing.
## What's Next
With your Experience named and your starting layout chosen, you're ready to build. The left panel gives you everything you need — components to drag onto the canvas, data connections to hook up, and the AI Builder standing by for anything you want to describe rather than drag.
## Next Steps
1. [Explore the Experience Builder](/essentials/inside-the-experience-builder) to understand every panel and control
2. [Add components](/essentials/experience-components-reference) to your pages
3. [Connect your pipeline data](/essentials/experience-connecting-data) to power the widgets
### Adding a Page
Click `+ Add Page` at the end of the page tab row to create a new blank page. Give it a name — this becomes the label shown in the Experience's left nav when published.
### Setting a Page Icon
Each page tab has an icon type dropdown to the left of the page name. Click the dropdown to choose the icon that appears next to the page name in the published nav. Icon types map to common page purposes — dashboard layouts, task views, activity feeds, and more.
### Reordering and Removing Pages
Drag page tabs left or right to reorder them. To remove a page, click the `×` on its tab. The first page in the tab order becomes the default landing page when someone opens the Experience.
Removing a page deletes all the widgets and data queries on that page. This action cannot be undone — make sure you don't need any of that content before removing.
## What's Next
With your Experience named and your starting layout chosen, you're ready to build. The left panel gives you everything you need — components to drag onto the canvas, data connections to hook up, and the AI Builder standing by for anything you want to describe rather than drag.
## Next Steps
1. [Explore the Experience Builder](/essentials/inside-the-experience-builder) to understand every panel and control
2. [Add components](/essentials/experience-components-reference) to your pages
3. [Connect your pipeline data](/essentials/experience-connecting-data) to power the widgets