> ## Documentation Index
> Fetch the complete documentation index at: https://docs.adopt.ai/llms.txt
> Use this file to discover all available pages before exploring further.
# Building Your First Pipeline
> A step-by-step guide to creating a Data Pipeline in Adopt AI — from naming it to activating your AI-generated workflow.
## Overview
Creating a Pipeline in Adopt AI is a three-step wizard followed by an AI-generated workflow you can refine before activating. The entire process takes about five minutes.
This guide walks through building a pipeline called **QuickBooks Expense Aggregation** as an example.
***
## Step 1 — Navigate to Pipelines
From the left sidebar, navigate to the **Pipelines**.
You'll land on the **All Pipelines** list. This shows all pipelines in your current project, along with their status, data source, schedule, and last update.
***
## Step 2 — Start a New Pipeline
Click the **+ New Pipeline** button in the top-right corner.
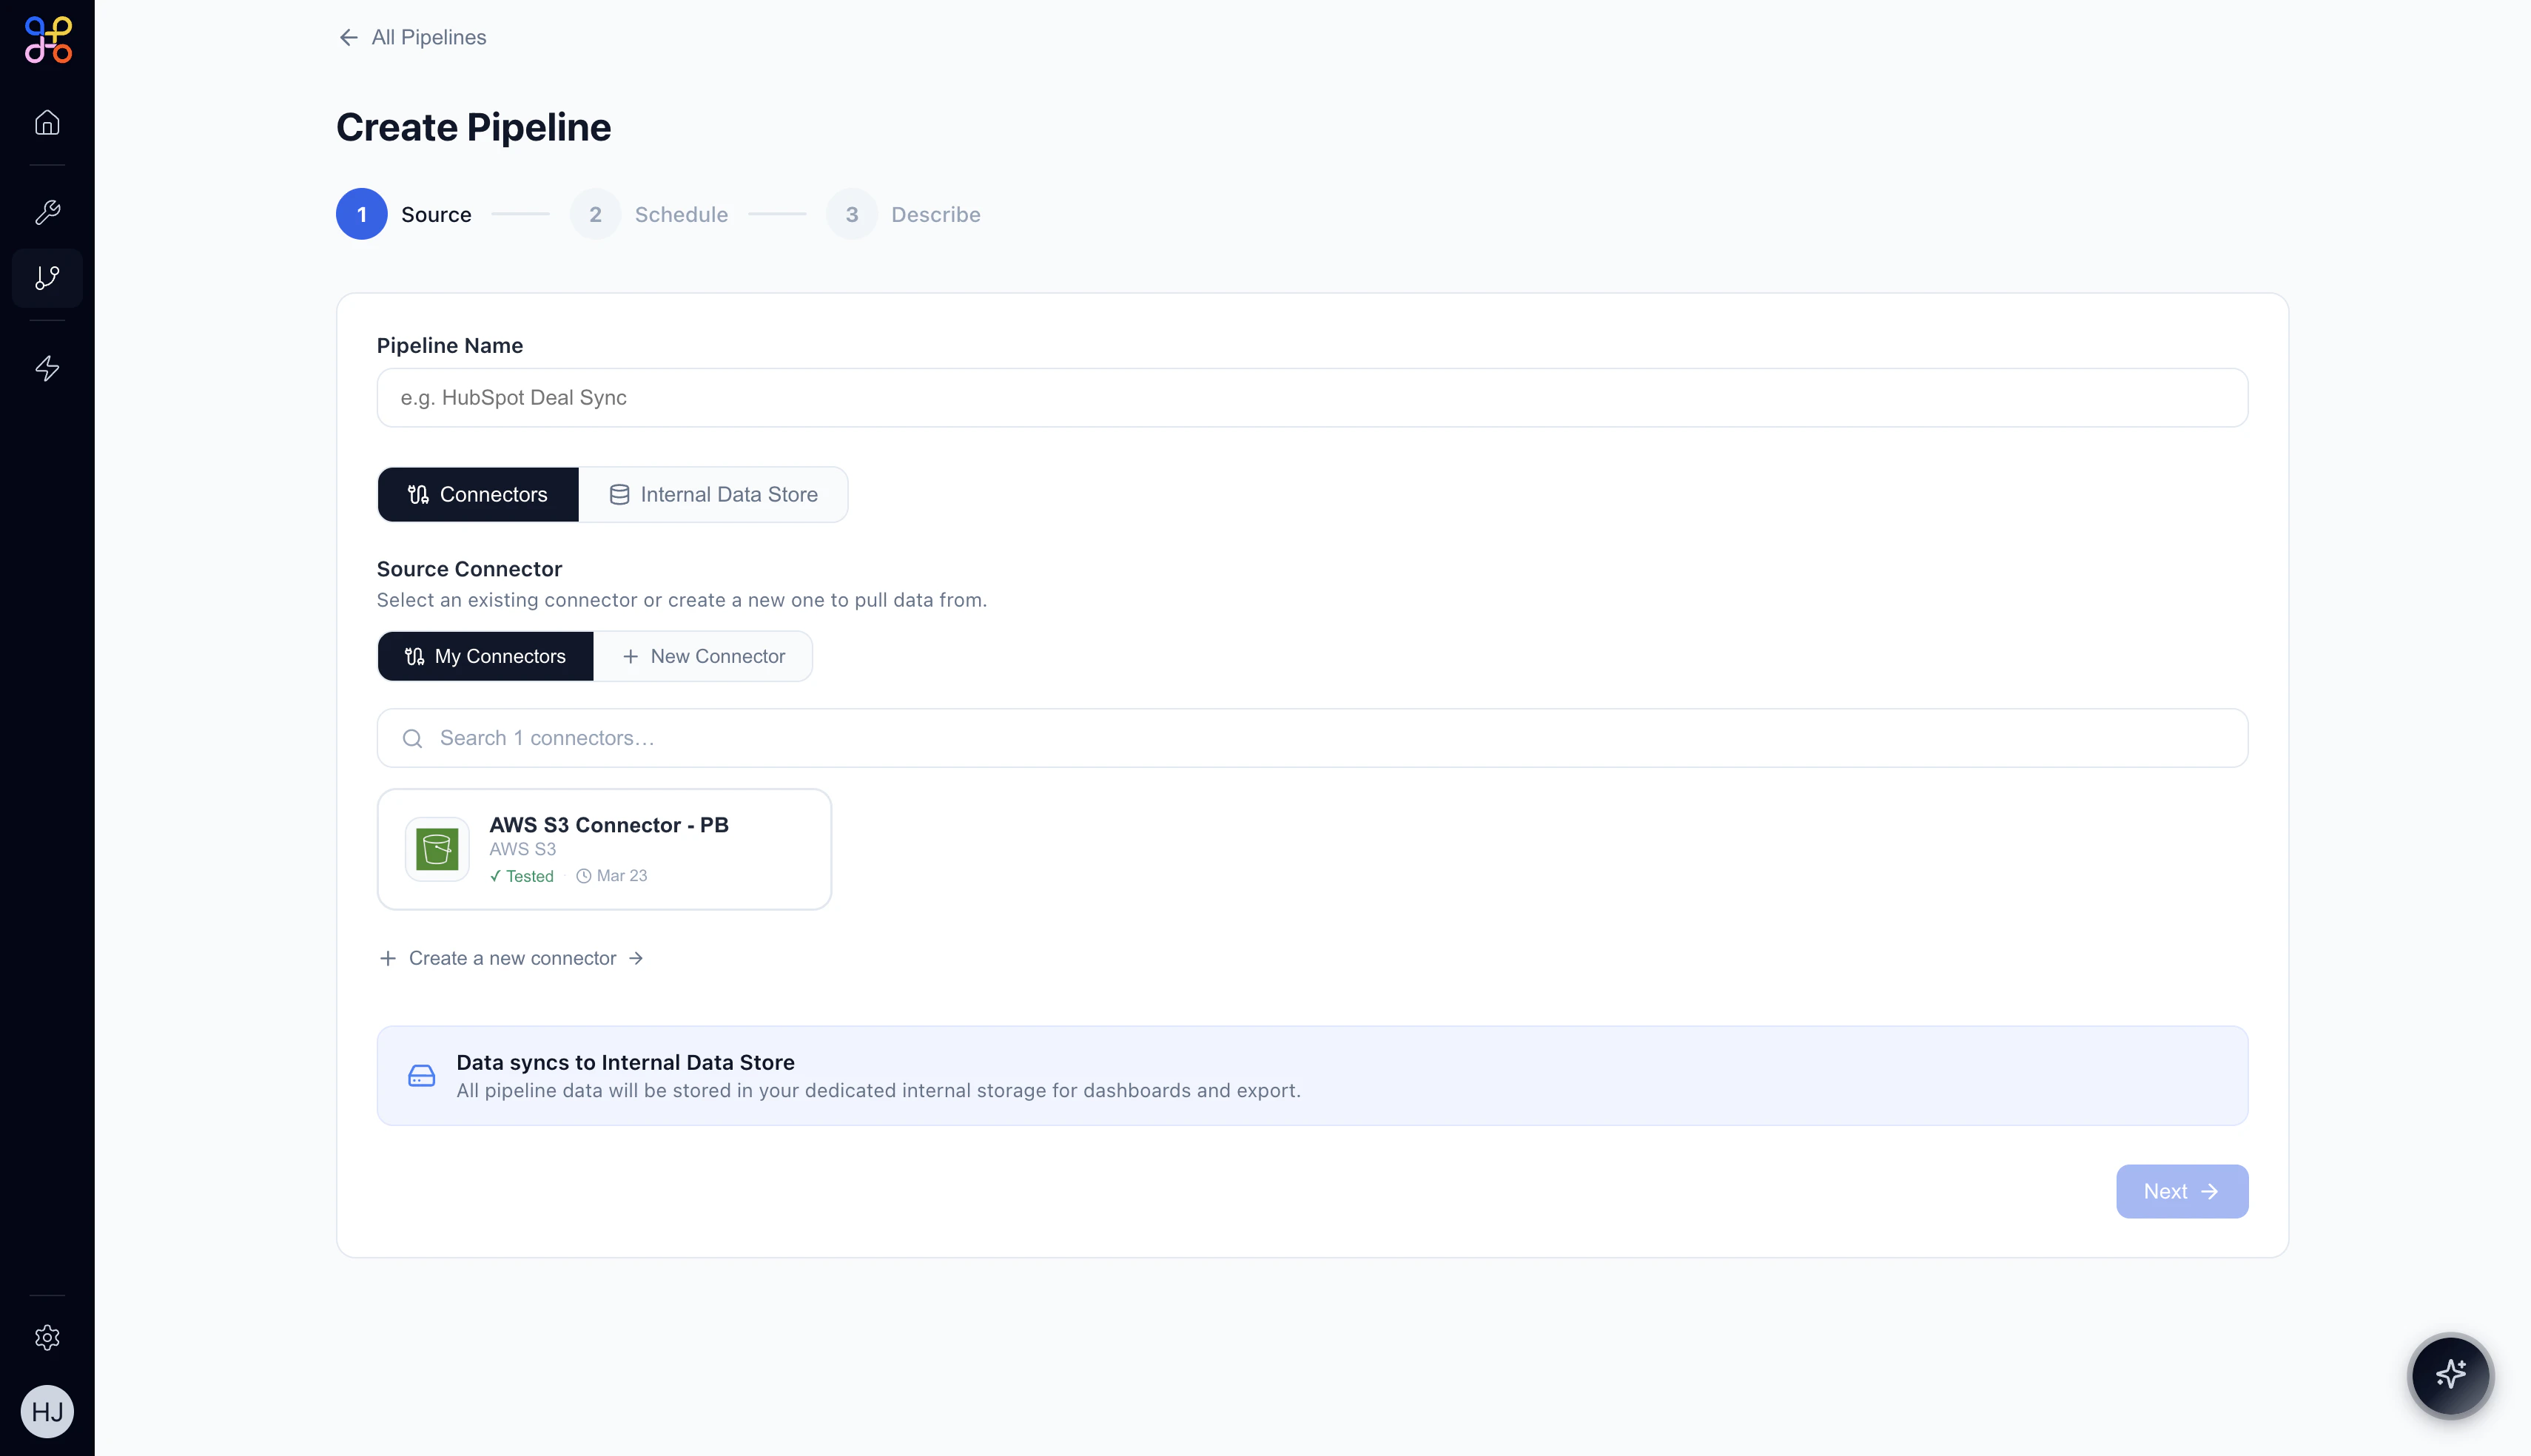 The **Create Pipeline** wizard opens. It has three steps shown at the top: **Source → Schedule → Describe**.
***
## Step 3 — Configure the Source (Step 1 of 3)
### 3.1 Name your Pipeline
Enter a descriptive name in the **Pipeline Name** field. Choose something that clearly conveys the data being extracted and its purpose.
**Examples:**
* `QuickBooks Expense Aggregation`
* `HubSpot Deal Sync`
* `Salesforce Account Overview`
### 3.2 Select your data source
Choose how data will be sourced:
* **Connectors** — pull data from an external system (HubSpot, AWS S3, QuickBooks, etc.)
* **Internal Data Store** — read from data already stored in Adopt AI
For most pipelines, you'll use **Connectors**.
### 3.3 Select a Connector
Under **Source Connector**, you'll see your available connectors. Click a connector card to select it.
The **Create Pipeline** wizard opens. It has three steps shown at the top: **Source → Schedule → Describe**.
***
## Step 3 — Configure the Source (Step 1 of 3)
### 3.1 Name your Pipeline
Enter a descriptive name in the **Pipeline Name** field. Choose something that clearly conveys the data being extracted and its purpose.
**Examples:**
* `QuickBooks Expense Aggregation`
* `HubSpot Deal Sync`
* `Salesforce Account Overview`
### 3.2 Select your data source
Choose how data will be sourced:
* **Connectors** — pull data from an external system (HubSpot, AWS S3, QuickBooks, etc.)
* **Internal Data Store** — read from data already stored in Adopt AI
For most pipelines, you'll use **Connectors**.
### 3.3 Select a Connector
Under **Source Connector**, you'll see your available connectors. Click a connector card to select it.
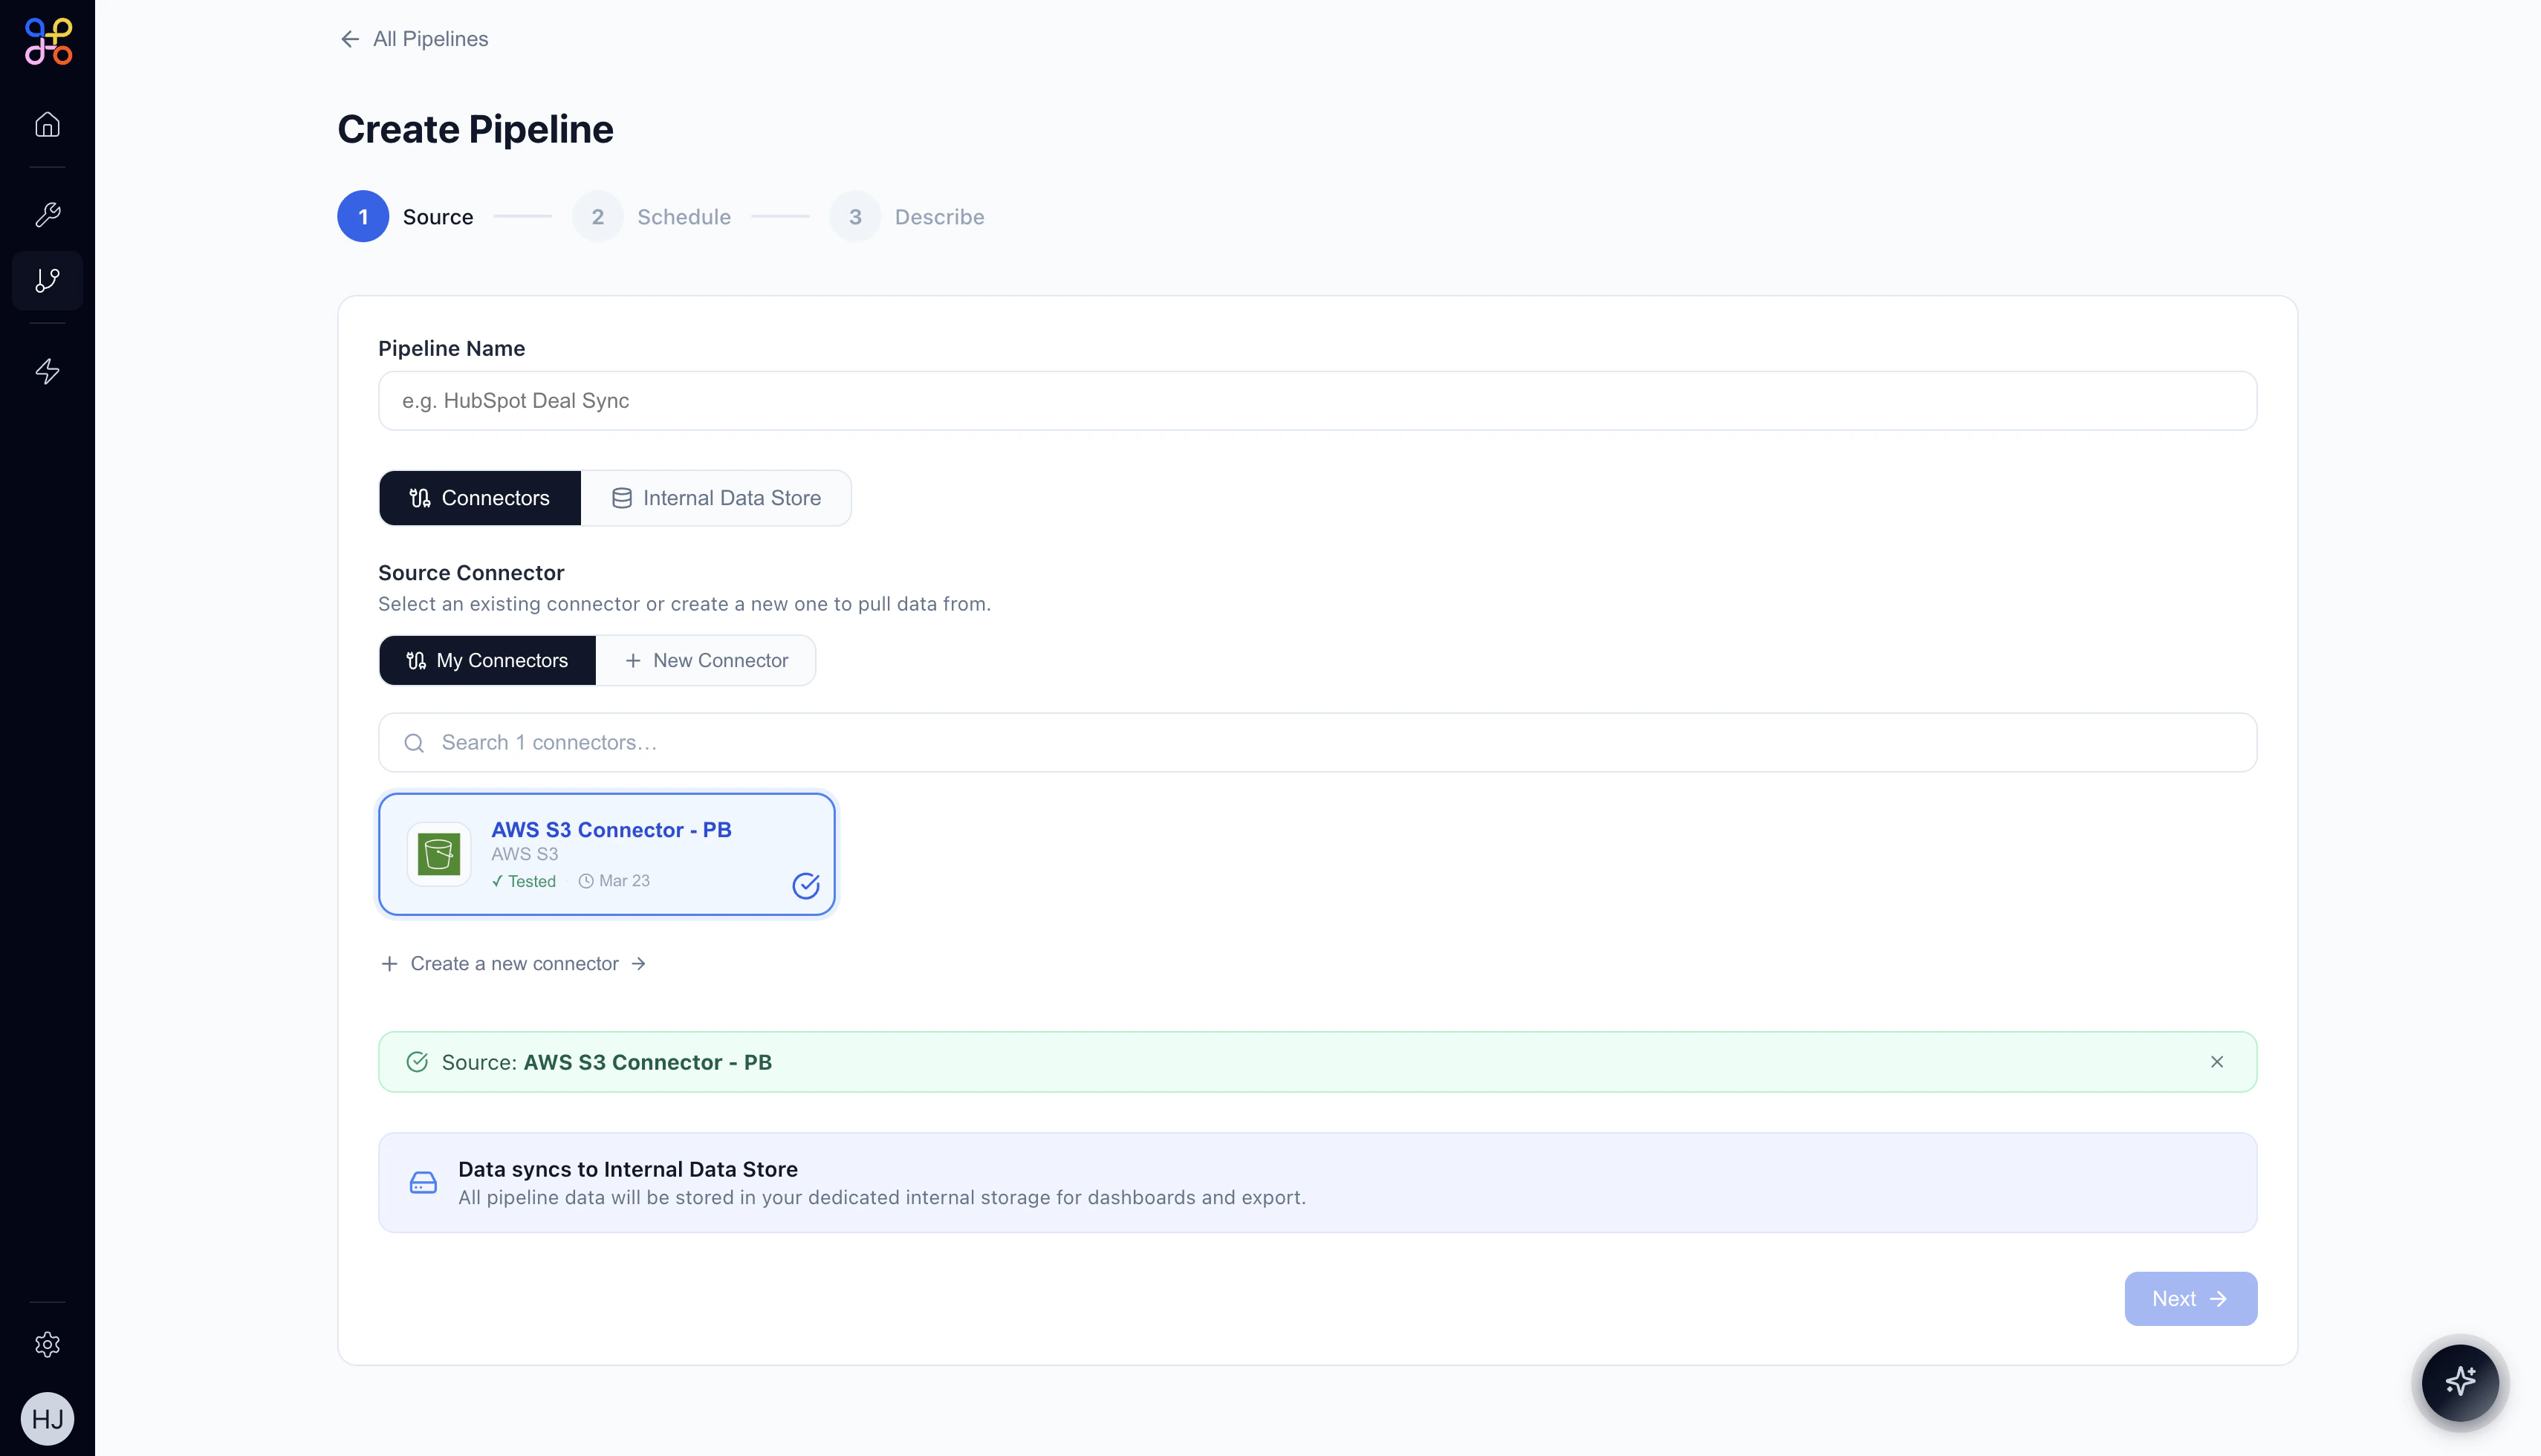 When a connector is selected, a confirmation banner appears.
If you don't have a connector for your data source, click **+ New Connector** or **"Create a new connector →"** to set one up.
At the bottom of the page, a notice confirms: **"Data syncs to Internal Data Store — All pipeline data will be stored in your dedicated internal storage for dashboards and export."**
Click **Next →** to proceed.
***
## Step 4 — Set the Schedule (Step 2 of 3)
When a connector is selected, a confirmation banner appears.
If you don't have a connector for your data source, click **+ New Connector** or **"Create a new connector →"** to set one up.
At the bottom of the page, a notice confirms: **"Data syncs to Internal Data Store — All pipeline data will be stored in your dedicated internal storage for dashboards and export."**
Click **Next →** to proceed.
***
## Step 4 — Set the Schedule (Step 2 of 3)
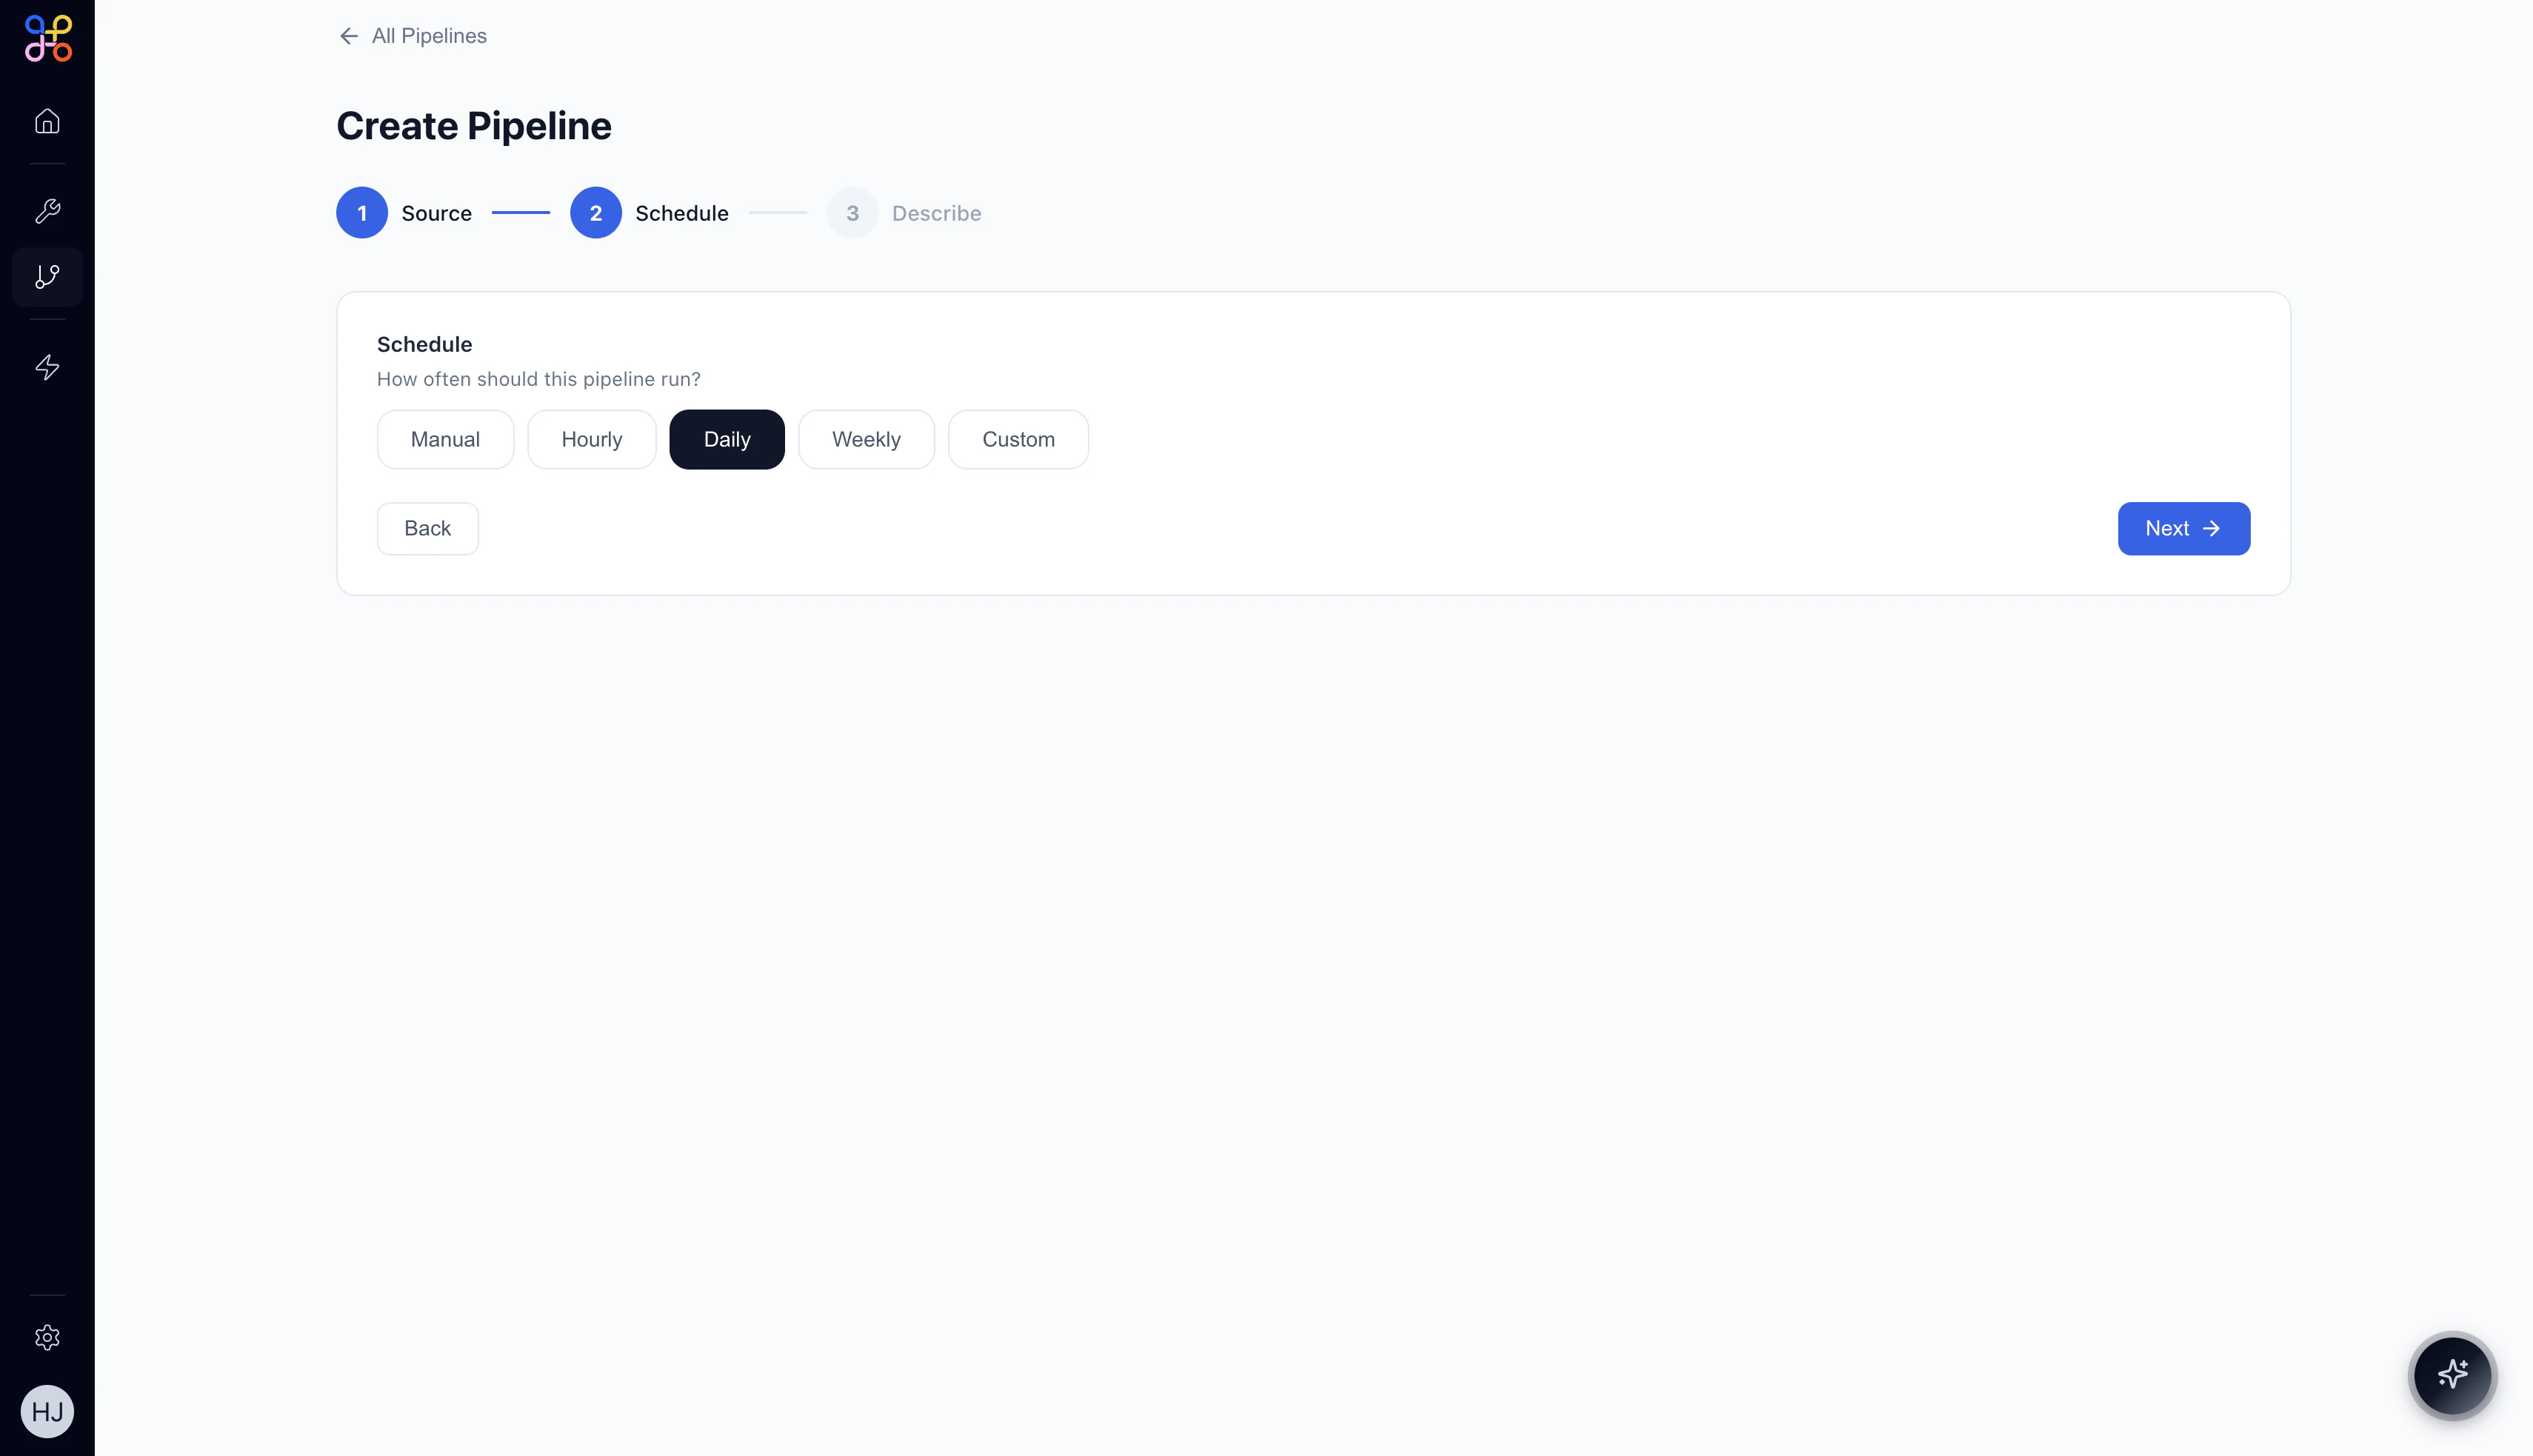 Choose how often the pipeline should run:
| Option | When to Use |
| ---------- | --------------------------------------------------------------- |
| **Manual** | Run on-demand only; useful for one-off extractions or testing |
| **Hourly** | Data needs to stay fresh throughout the day (e.g., CRM deals) |
| **Daily** | Most common for reporting and analysis pipelines |
| **Weekly** | Lower-frequency aggregations (e.g., weekly financial summaries) |
| **Custom** | Enter a cron expression for fine-grained control |
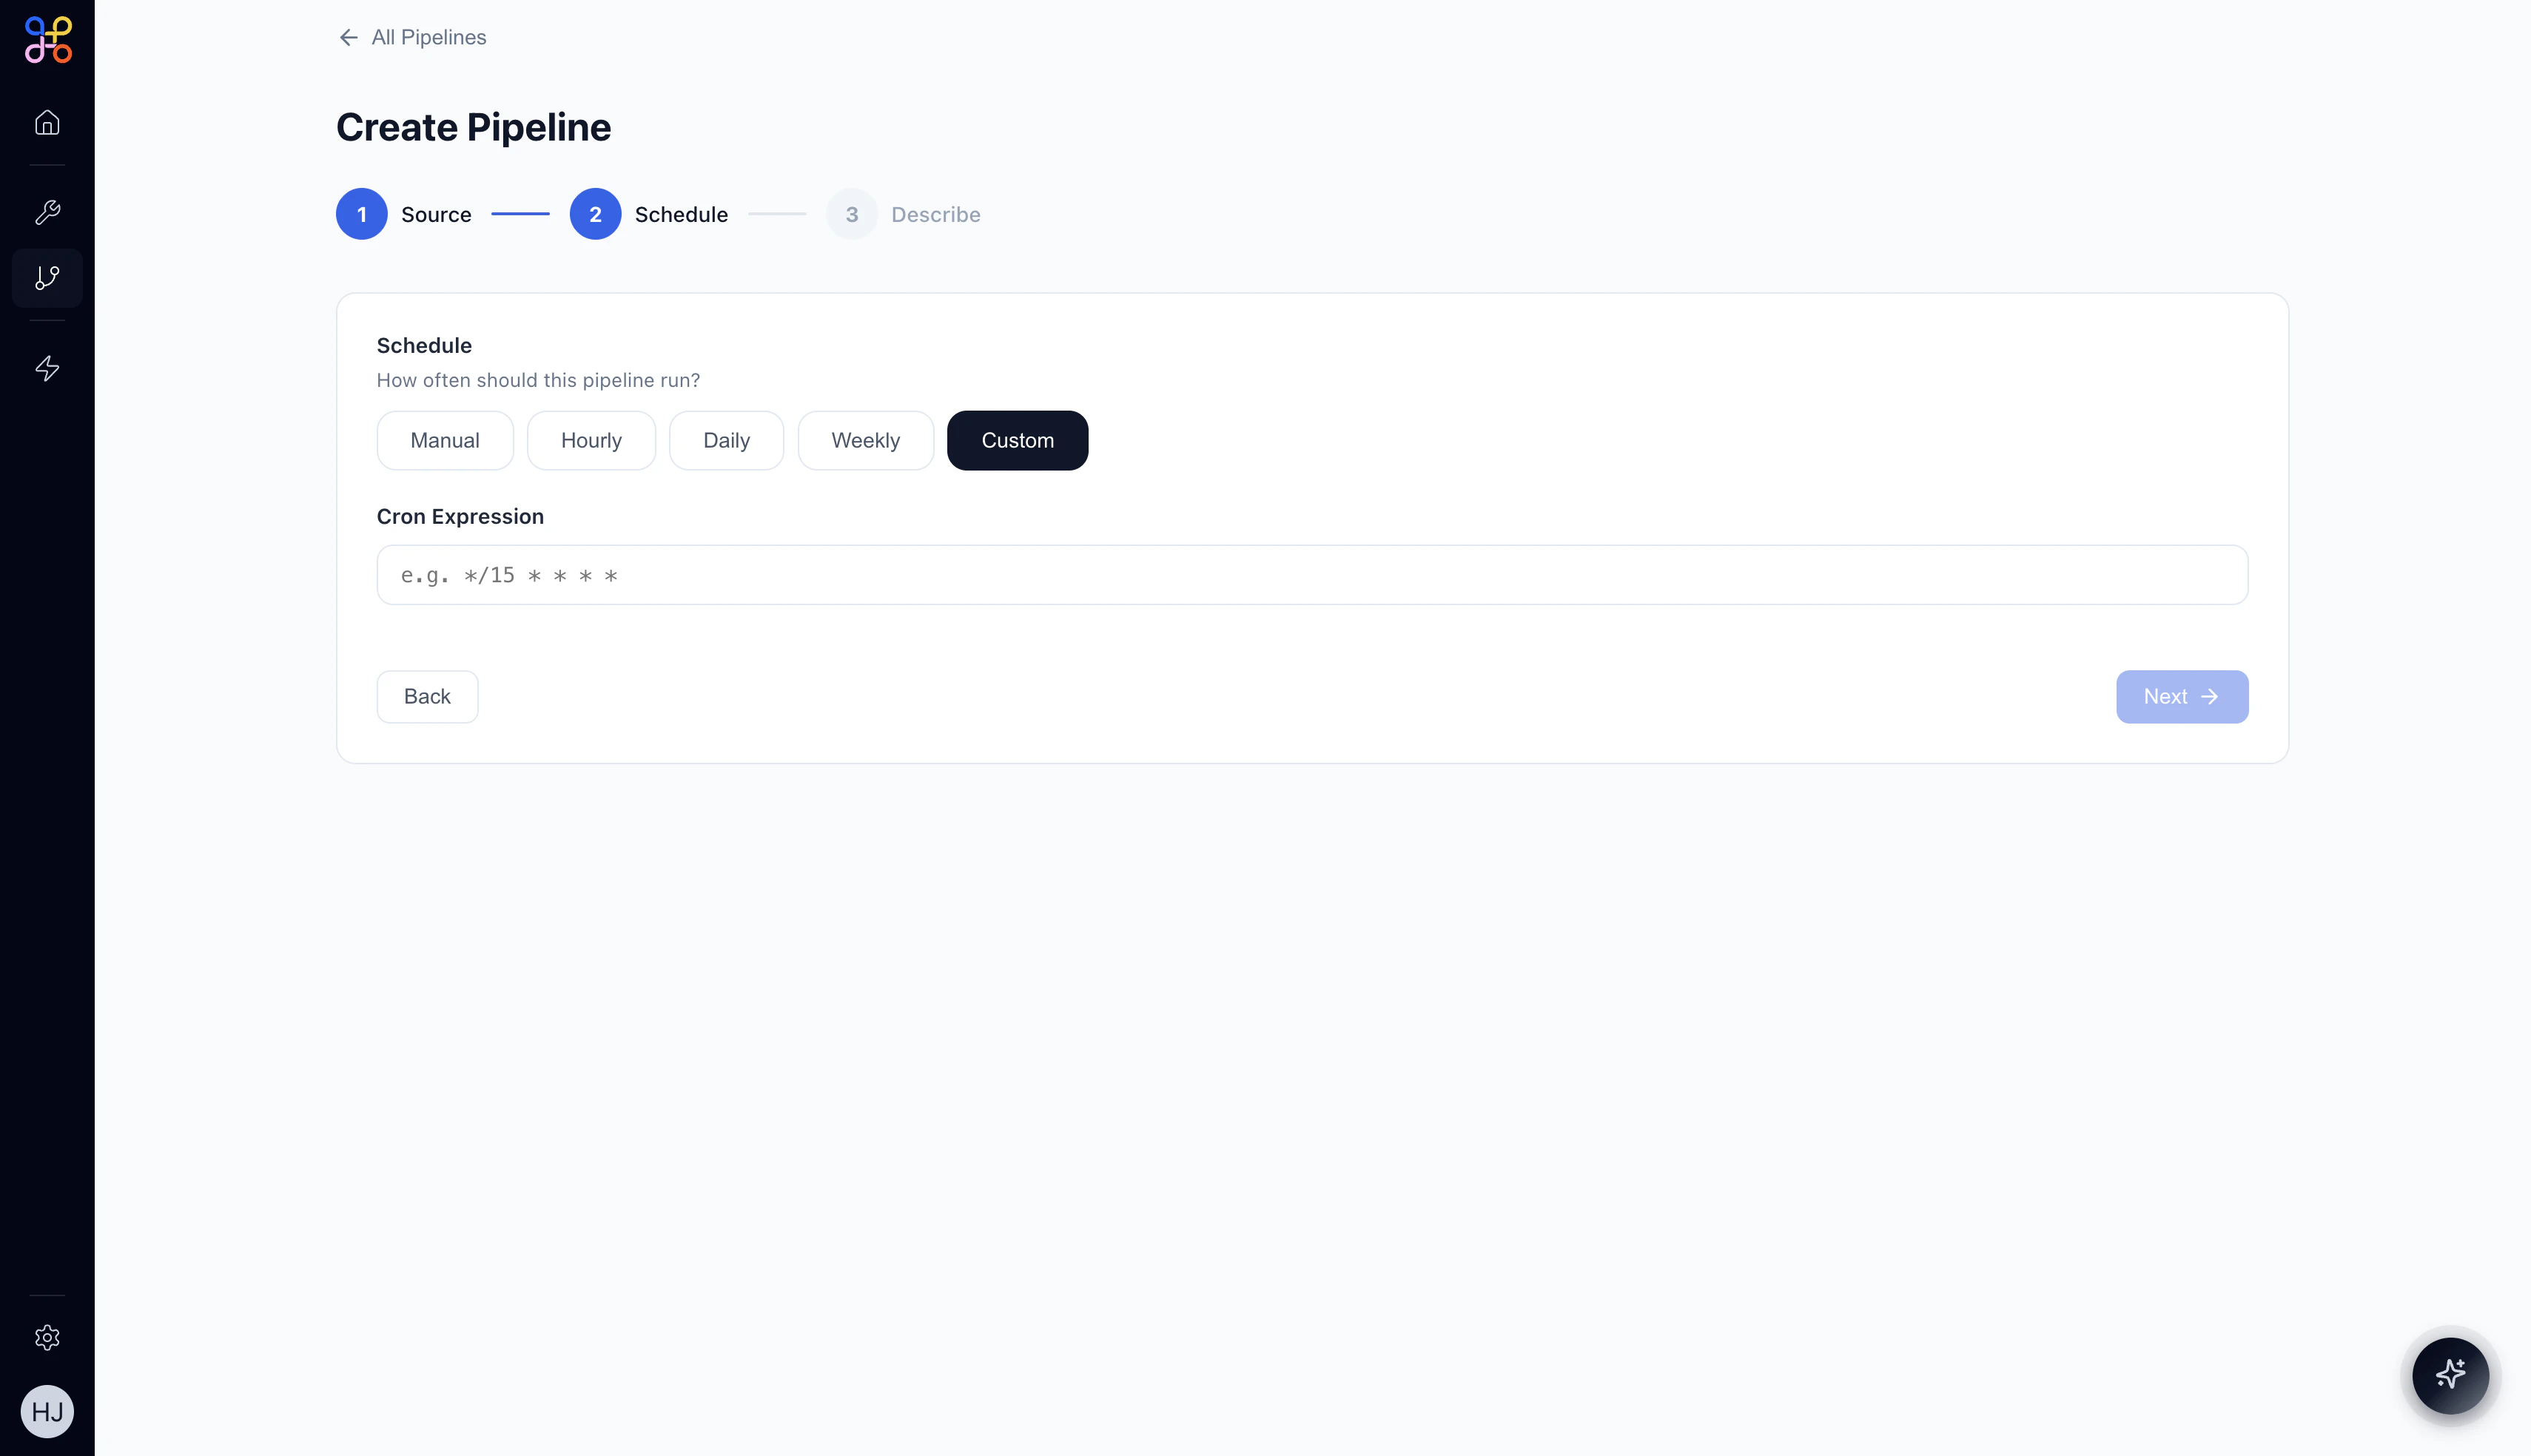
**Custom schedule** reveals a **Cron Expression** field. For example, `*/15 * * * *` runs every 15 minutes.
Choose how often the pipeline should run:
| Option | When to Use |
| ---------- | --------------------------------------------------------------- |
| **Manual** | Run on-demand only; useful for one-off extractions or testing |
| **Hourly** | Data needs to stay fresh throughout the day (e.g., CRM deals) |
| **Daily** | Most common for reporting and analysis pipelines |
| **Weekly** | Lower-frequency aggregations (e.g., weekly financial summaries) |
| **Custom** | Enter a cron expression for fine-grained control |
**Custom schedule** reveals a **Cron Expression** field. For example, `*/15 * * * *` runs every 15 minutes.
 For most analytics and reporting pipelines, **Daily** is the right choice. Use **Hourly** when agents need fresh data throughout the working day.
Click **Next →** to proceed.
***
## Step 5 — Describe the Pipeline (Step 3 of 3)
For most analytics and reporting pipelines, **Daily** is the right choice. Use **Hourly** when agents need fresh data throughout the working day.
Click **Next →** to proceed.
***
## Step 5 — Describe the Pipeline (Step 3 of 3)
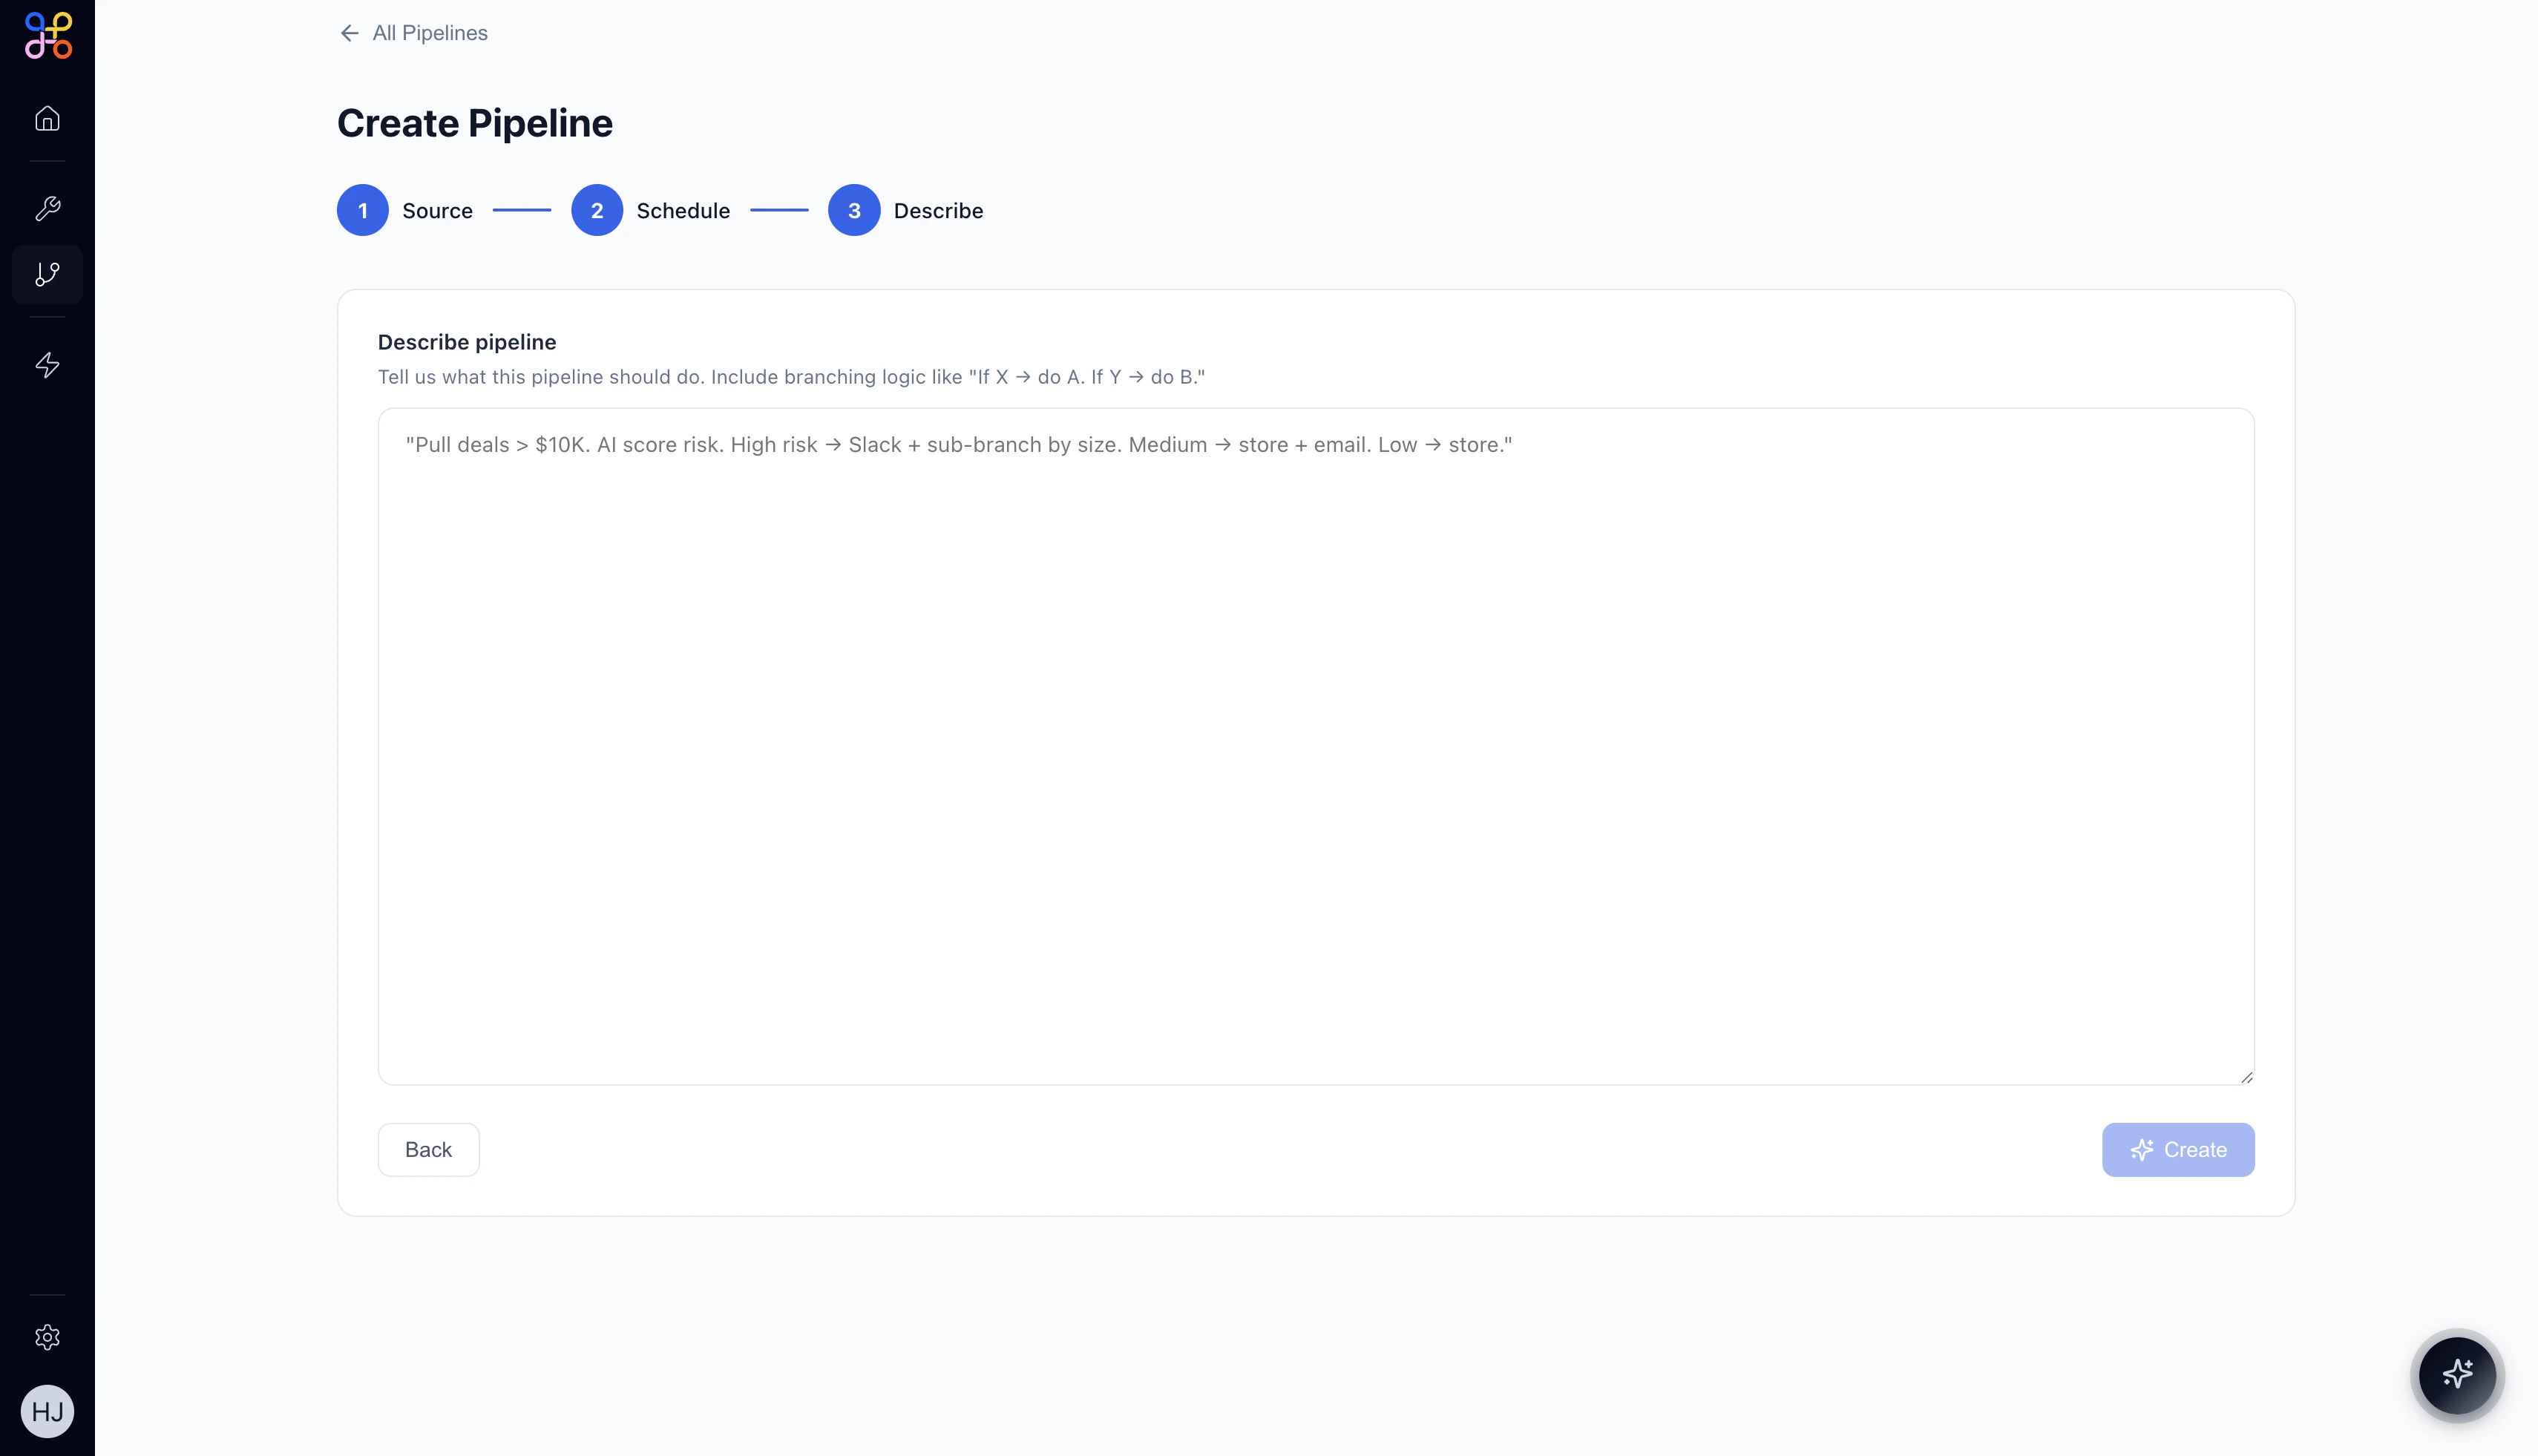 This is where Adopt AI's AI capability comes in. Rather than manually configuring each extraction and transformation step, you **describe what you want the pipeline to do in plain English**.
In the text area, write a description that includes:
* What data to extract
* Any filters or conditions
* How to transform or aggregate the data
* What the final output should look like
**Example description:**
```text theme={null}
Pull all expense records from the data source. Filter to only include expenses
over $500. Aggregate by category and store the results as a structured table.
```
You can also include branching logic:
```text theme={null}
Pull deals > $10K. AI score risk. High risk → Slack + sub-branch by size.
Medium → store + email. Low → store.
```
Click **✦ Create** to generate the pipeline.
***
## Step 6 — Review the AI-Generated Workflow
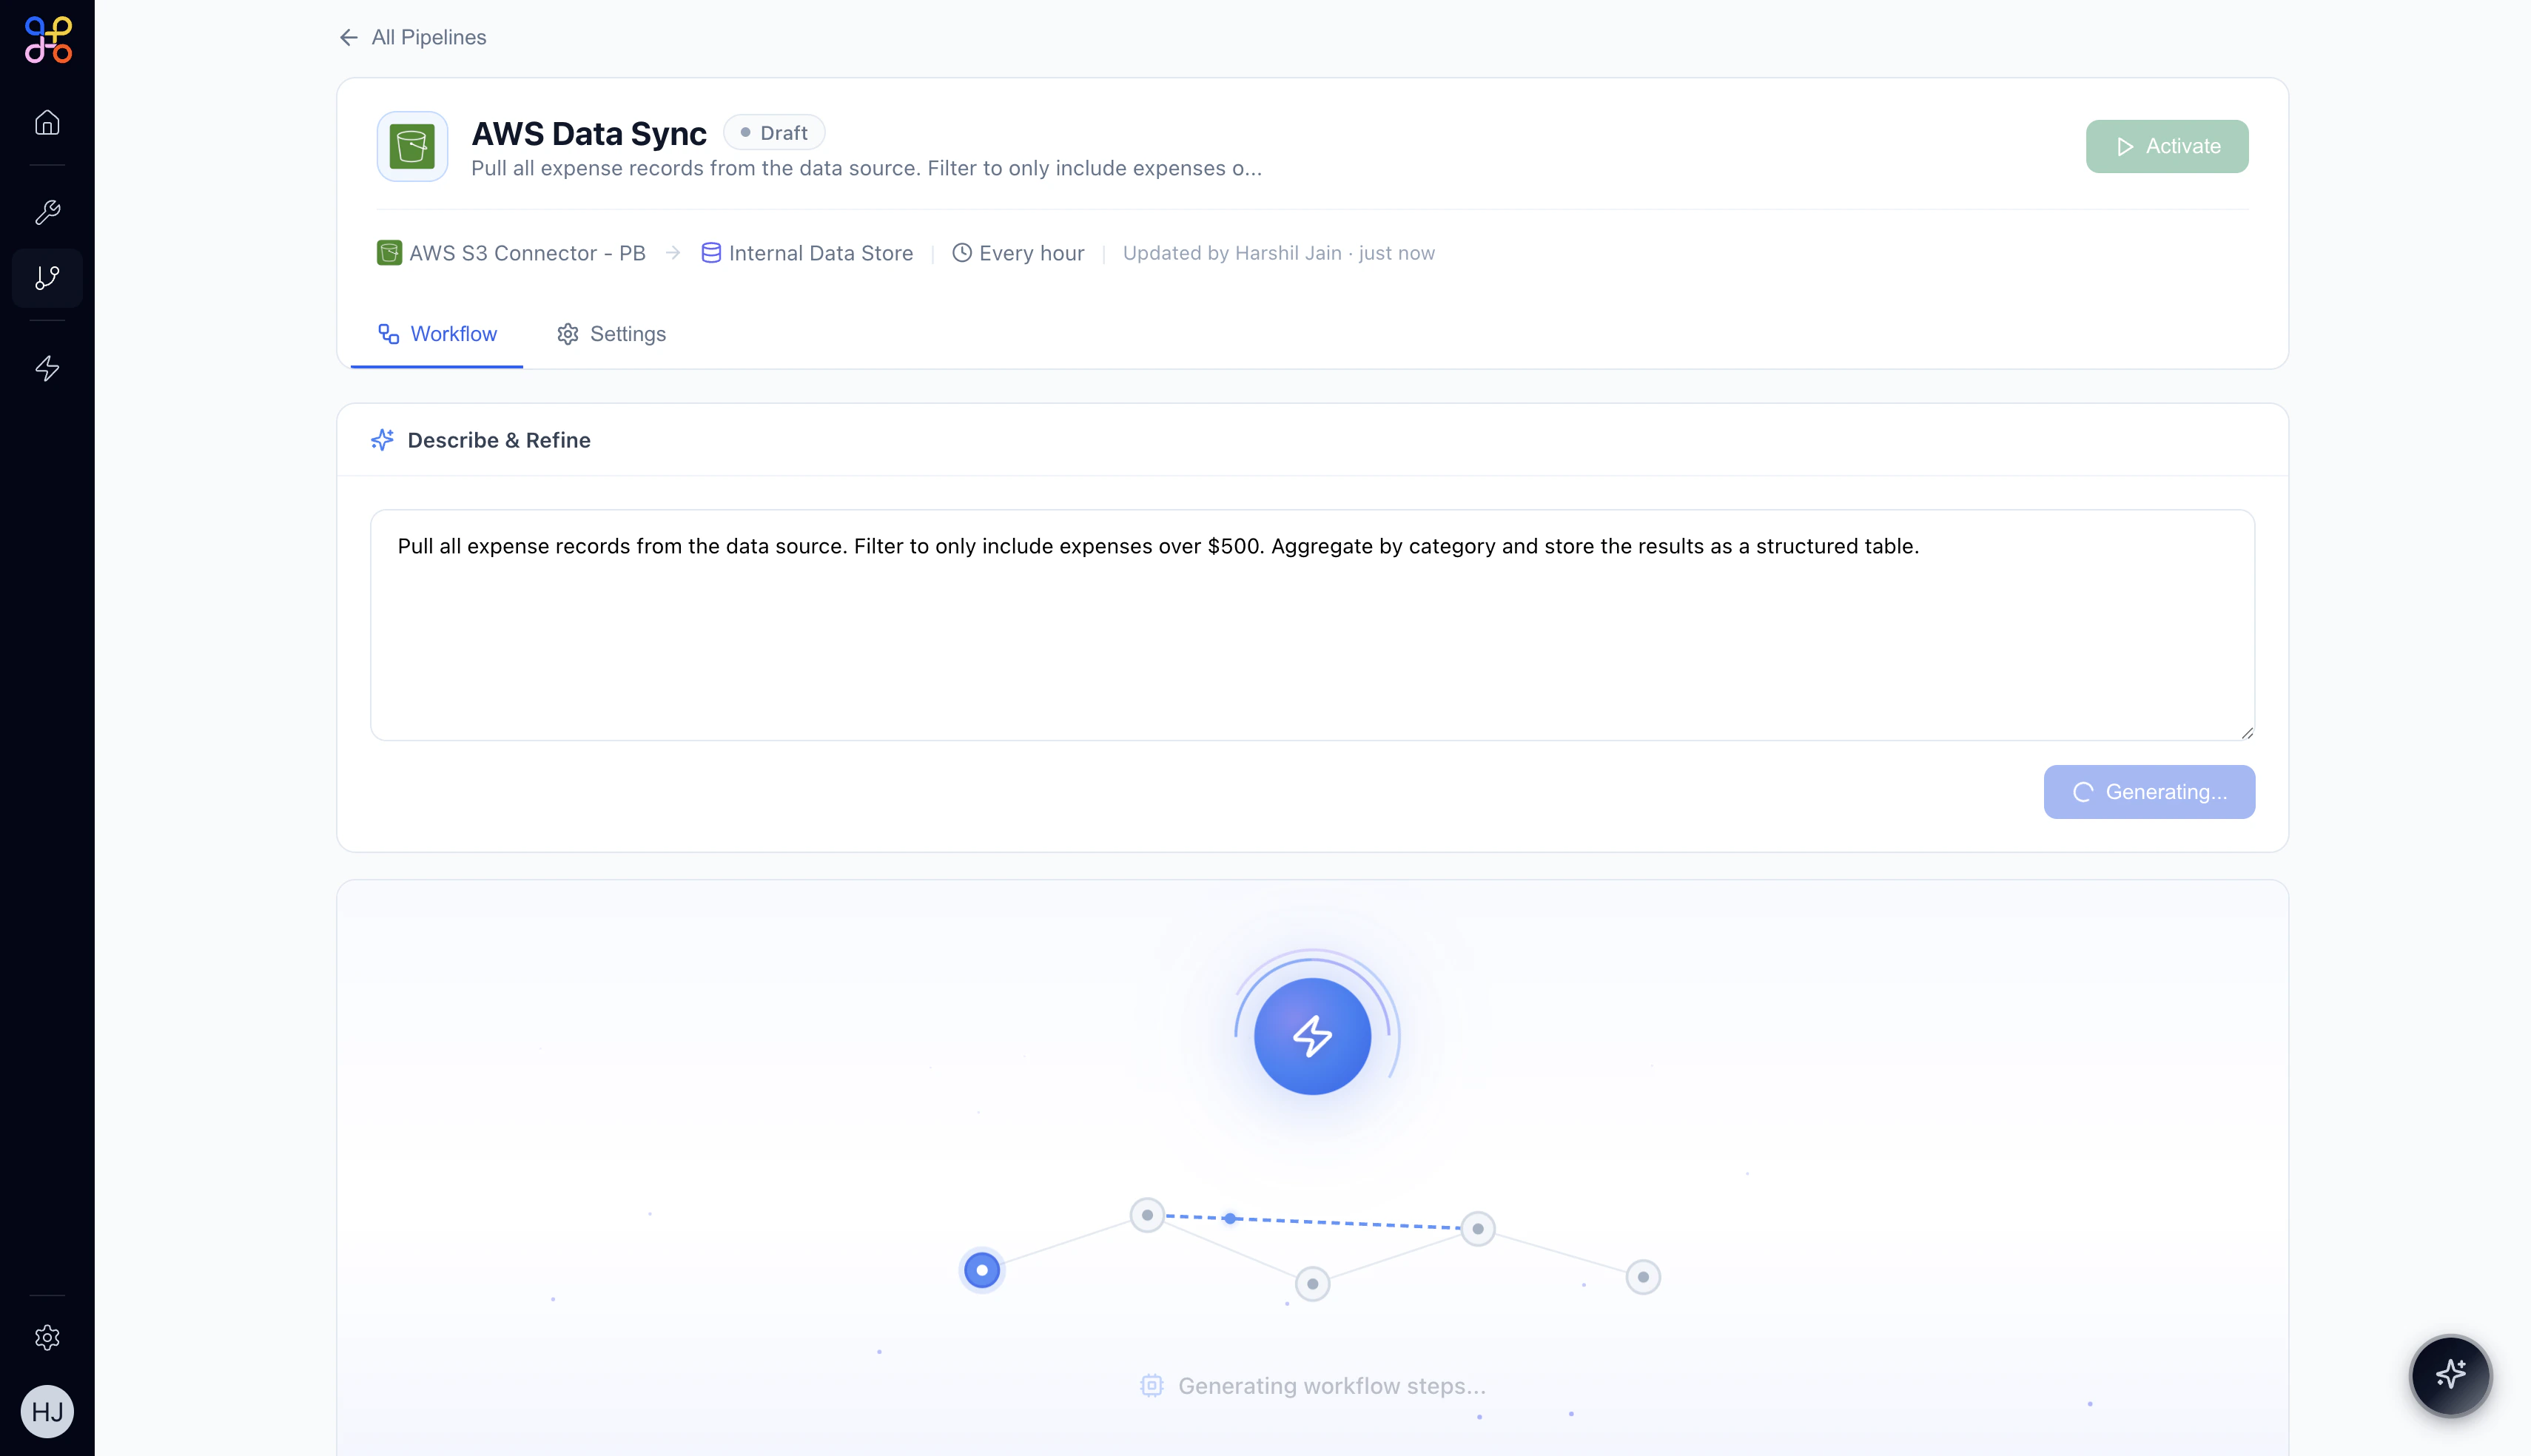
After clicking **Create**, Adopt AI generates a complete workflow from your description. The pipeline enters **Draft** status while the AI builds the workflow graph.
This is where Adopt AI's AI capability comes in. Rather than manually configuring each extraction and transformation step, you **describe what you want the pipeline to do in plain English**.
In the text area, write a description that includes:
* What data to extract
* Any filters or conditions
* How to transform or aggregate the data
* What the final output should look like
**Example description:**
```text theme={null}
Pull all expense records from the data source. Filter to only include expenses
over $500. Aggregate by category and store the results as a structured table.
```
You can also include branching logic:
```text theme={null}
Pull deals > $10K. AI score risk. High risk → Slack + sub-branch by size.
Medium → store + email. Low → store.
```
Click **✦ Create** to generate the pipeline.
***
## Step 6 — Review the AI-Generated Workflow
After clicking **Create**, Adopt AI generates a complete workflow from your description. The pipeline enters **Draft** status while the AI builds the workflow graph.
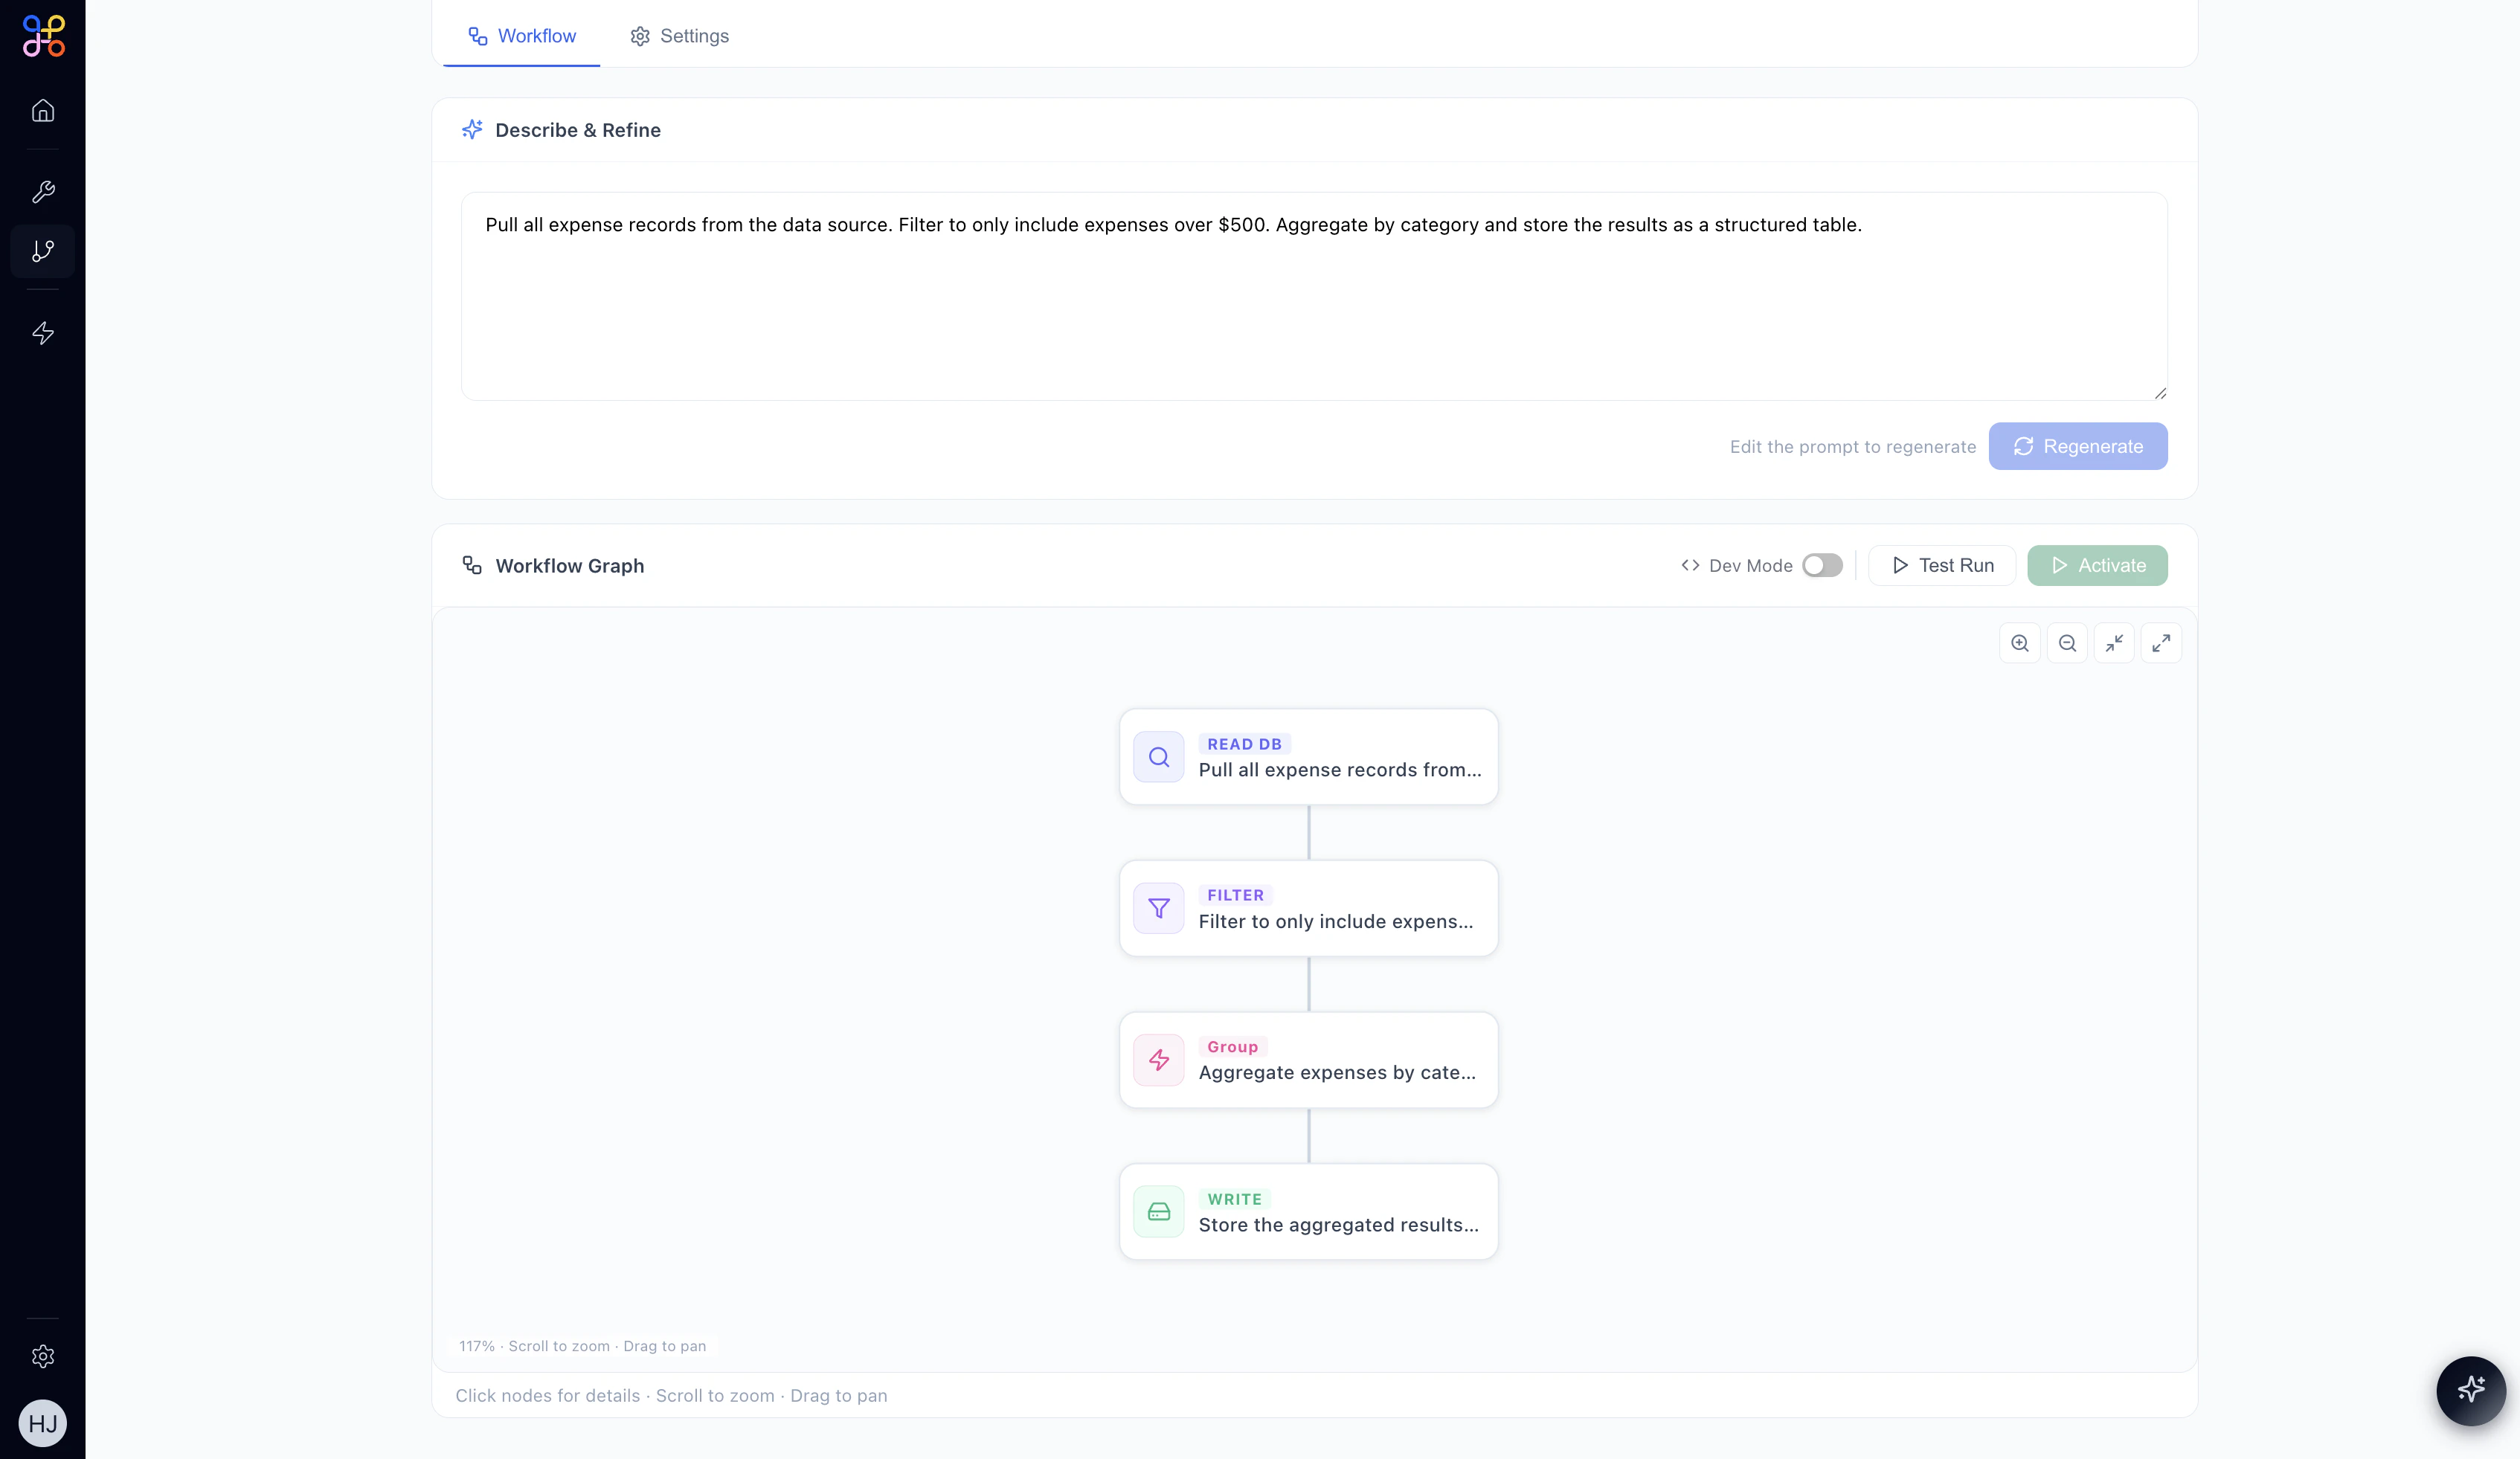
 The generated workflow will appear as a **Workflow Graph** with connected nodes. Based on your description, nodes might include:
* **READ DB** — pulls data from your connected source
* **FILTER** — applies your filter conditions
* **GROUP / TRANSFORM** — aggregates or reshapes the data
* **WRITE** — stores the final output as a named Pipeline Outcome
The generated workflow will appear as a **Workflow Graph** with connected nodes. Based on your description, nodes might include:
* **READ DB** — pulls data from your connected source
* **FILTER** — applies your filter conditions
* **GROUP / TRANSFORM** — aggregates or reshapes the data
* **WRITE** — stores the final output as a named Pipeline Outcome
 ### Refining the Pipeline
In **Draft** state you can:
* **Edit the description** in the "Describe & Refine" text area and click **Regenerate** to create a new workflow
* **Click individual nodes** to inspect their configuration (fields and JSON view)
* **Toggle Dev Mode** to inspect the raw workflow definition
* **Run a Test Run** to validate the pipeline before activating
Always run a **Test Run** before activating a pipeline in production. This validates that your connector credentials are correct and the workflow produces the expected output.
***
## Step 7 — Activate the Pipeline
When you're satisfied with the workflow, click the **Activate** button (top-right or within the Workflow Graph header).
The pipeline will:
1. Change status from **Draft** to **Active**
2. Begin running immediately on its first execution
3. Continue running on the schedule you defined
Once active, the pipeline detail view gains additional tabs: **Overview**, **Runs**, and **Data** — where you can monitor execution health and preview output records.
***
## What Comes Next?
Your pipeline is now running and producing data. Here's what to do next:
* **View run history** on the **Runs** tab — see every execution with its start time, duration, and status
* **Preview the output data** on the **Data** tab — inspect the Pipeline Outcome table
* **Connect it to an Agent** — add a Pipeline node in your agent canvas to give the agent access to this data
* **Bind it to an Experience** — surface the data in a HITL dashboard for human reviewers
See [Pipeline Features](/essentials/pipelines-features) for a full reference of all pipeline capabilities.
### Refining the Pipeline
In **Draft** state you can:
* **Edit the description** in the "Describe & Refine" text area and click **Regenerate** to create a new workflow
* **Click individual nodes** to inspect their configuration (fields and JSON view)
* **Toggle Dev Mode** to inspect the raw workflow definition
* **Run a Test Run** to validate the pipeline before activating
Always run a **Test Run** before activating a pipeline in production. This validates that your connector credentials are correct and the workflow produces the expected output.
***
## Step 7 — Activate the Pipeline
When you're satisfied with the workflow, click the **Activate** button (top-right or within the Workflow Graph header).
The pipeline will:
1. Change status from **Draft** to **Active**
2. Begin running immediately on its first execution
3. Continue running on the schedule you defined
Once active, the pipeline detail view gains additional tabs: **Overview**, **Runs**, and **Data** — where you can monitor execution health and preview output records.
***
## What Comes Next?
Your pipeline is now running and producing data. Here's what to do next:
* **View run history** on the **Runs** tab — see every execution with its start time, duration, and status
* **Preview the output data** on the **Data** tab — inspect the Pipeline Outcome table
* **Connect it to an Agent** — add a Pipeline node in your agent canvas to give the agent access to this data
* **Bind it to an Experience** — surface the data in a HITL dashboard for human reviewers
See [Pipeline Features](/essentials/pipelines-features) for a full reference of all pipeline capabilities.