> ## Documentation Index
> Fetch the complete documentation index at: https://docs.adopt.ai/llms.txt
> Use this file to discover all available pages before exploring further.
# Pipeline Features
> A reference guide to all Pipeline capabilities — scheduling, workflow nodes, monitoring, output data, and configuration.
## Overview
This page covers every feature available in the Pipeline module. Use it as a reference when building, monitoring, or troubleshooting your pipelines.
***
## Pipeline Statuses
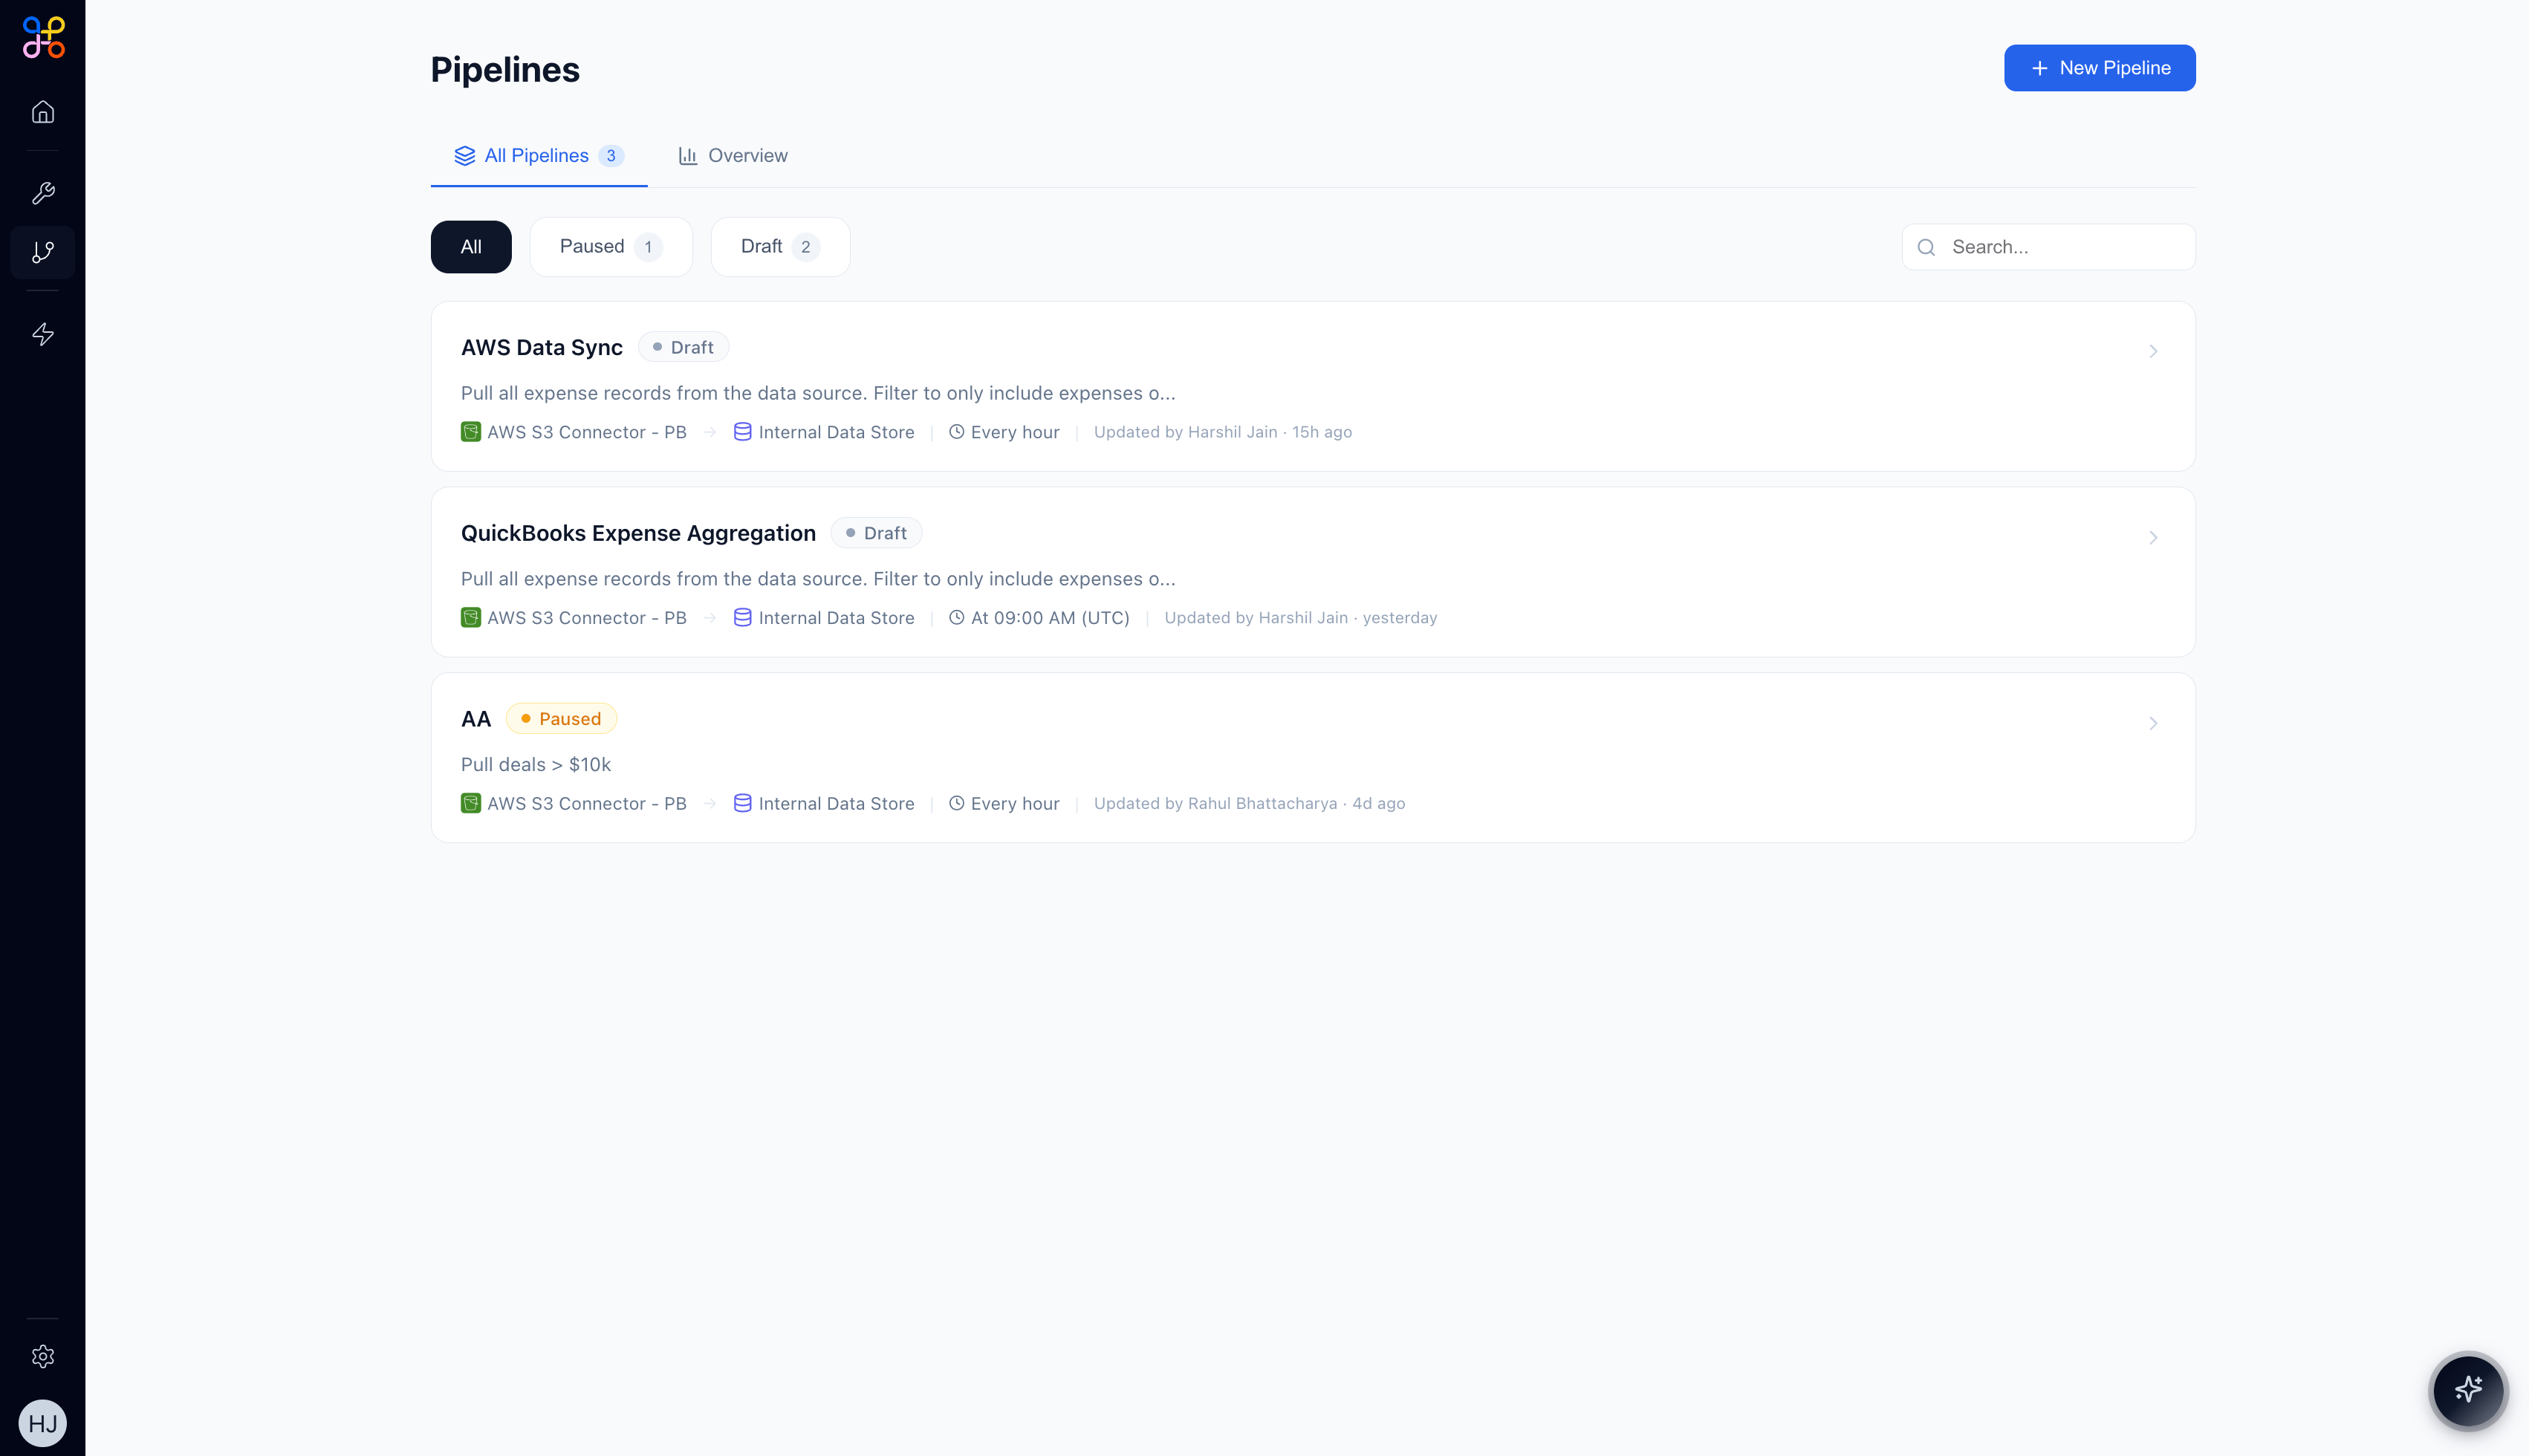
A pipeline can be in one of three states:
| Status | Description |
| ---------- | -------------------------------------------------------------------------------------------------- |
| **Draft** | Pipeline has been created but not yet activated. Workflow is editable and test runs are available. |
| **Active** | Pipeline is running on its defined schedule. Outcomes are continuously refreshed. |
| **Paused** | Pipeline is stopped. The last outcome is preserved but not updated. Resume when ready. |
 ***
## The Overview Tab
When you open a pipeline, the **Overview** tab gives you a health summary at a glance.
***
## The Overview Tab
When you open a pipeline, the **Overview** tab gives you a health summary at a glance.
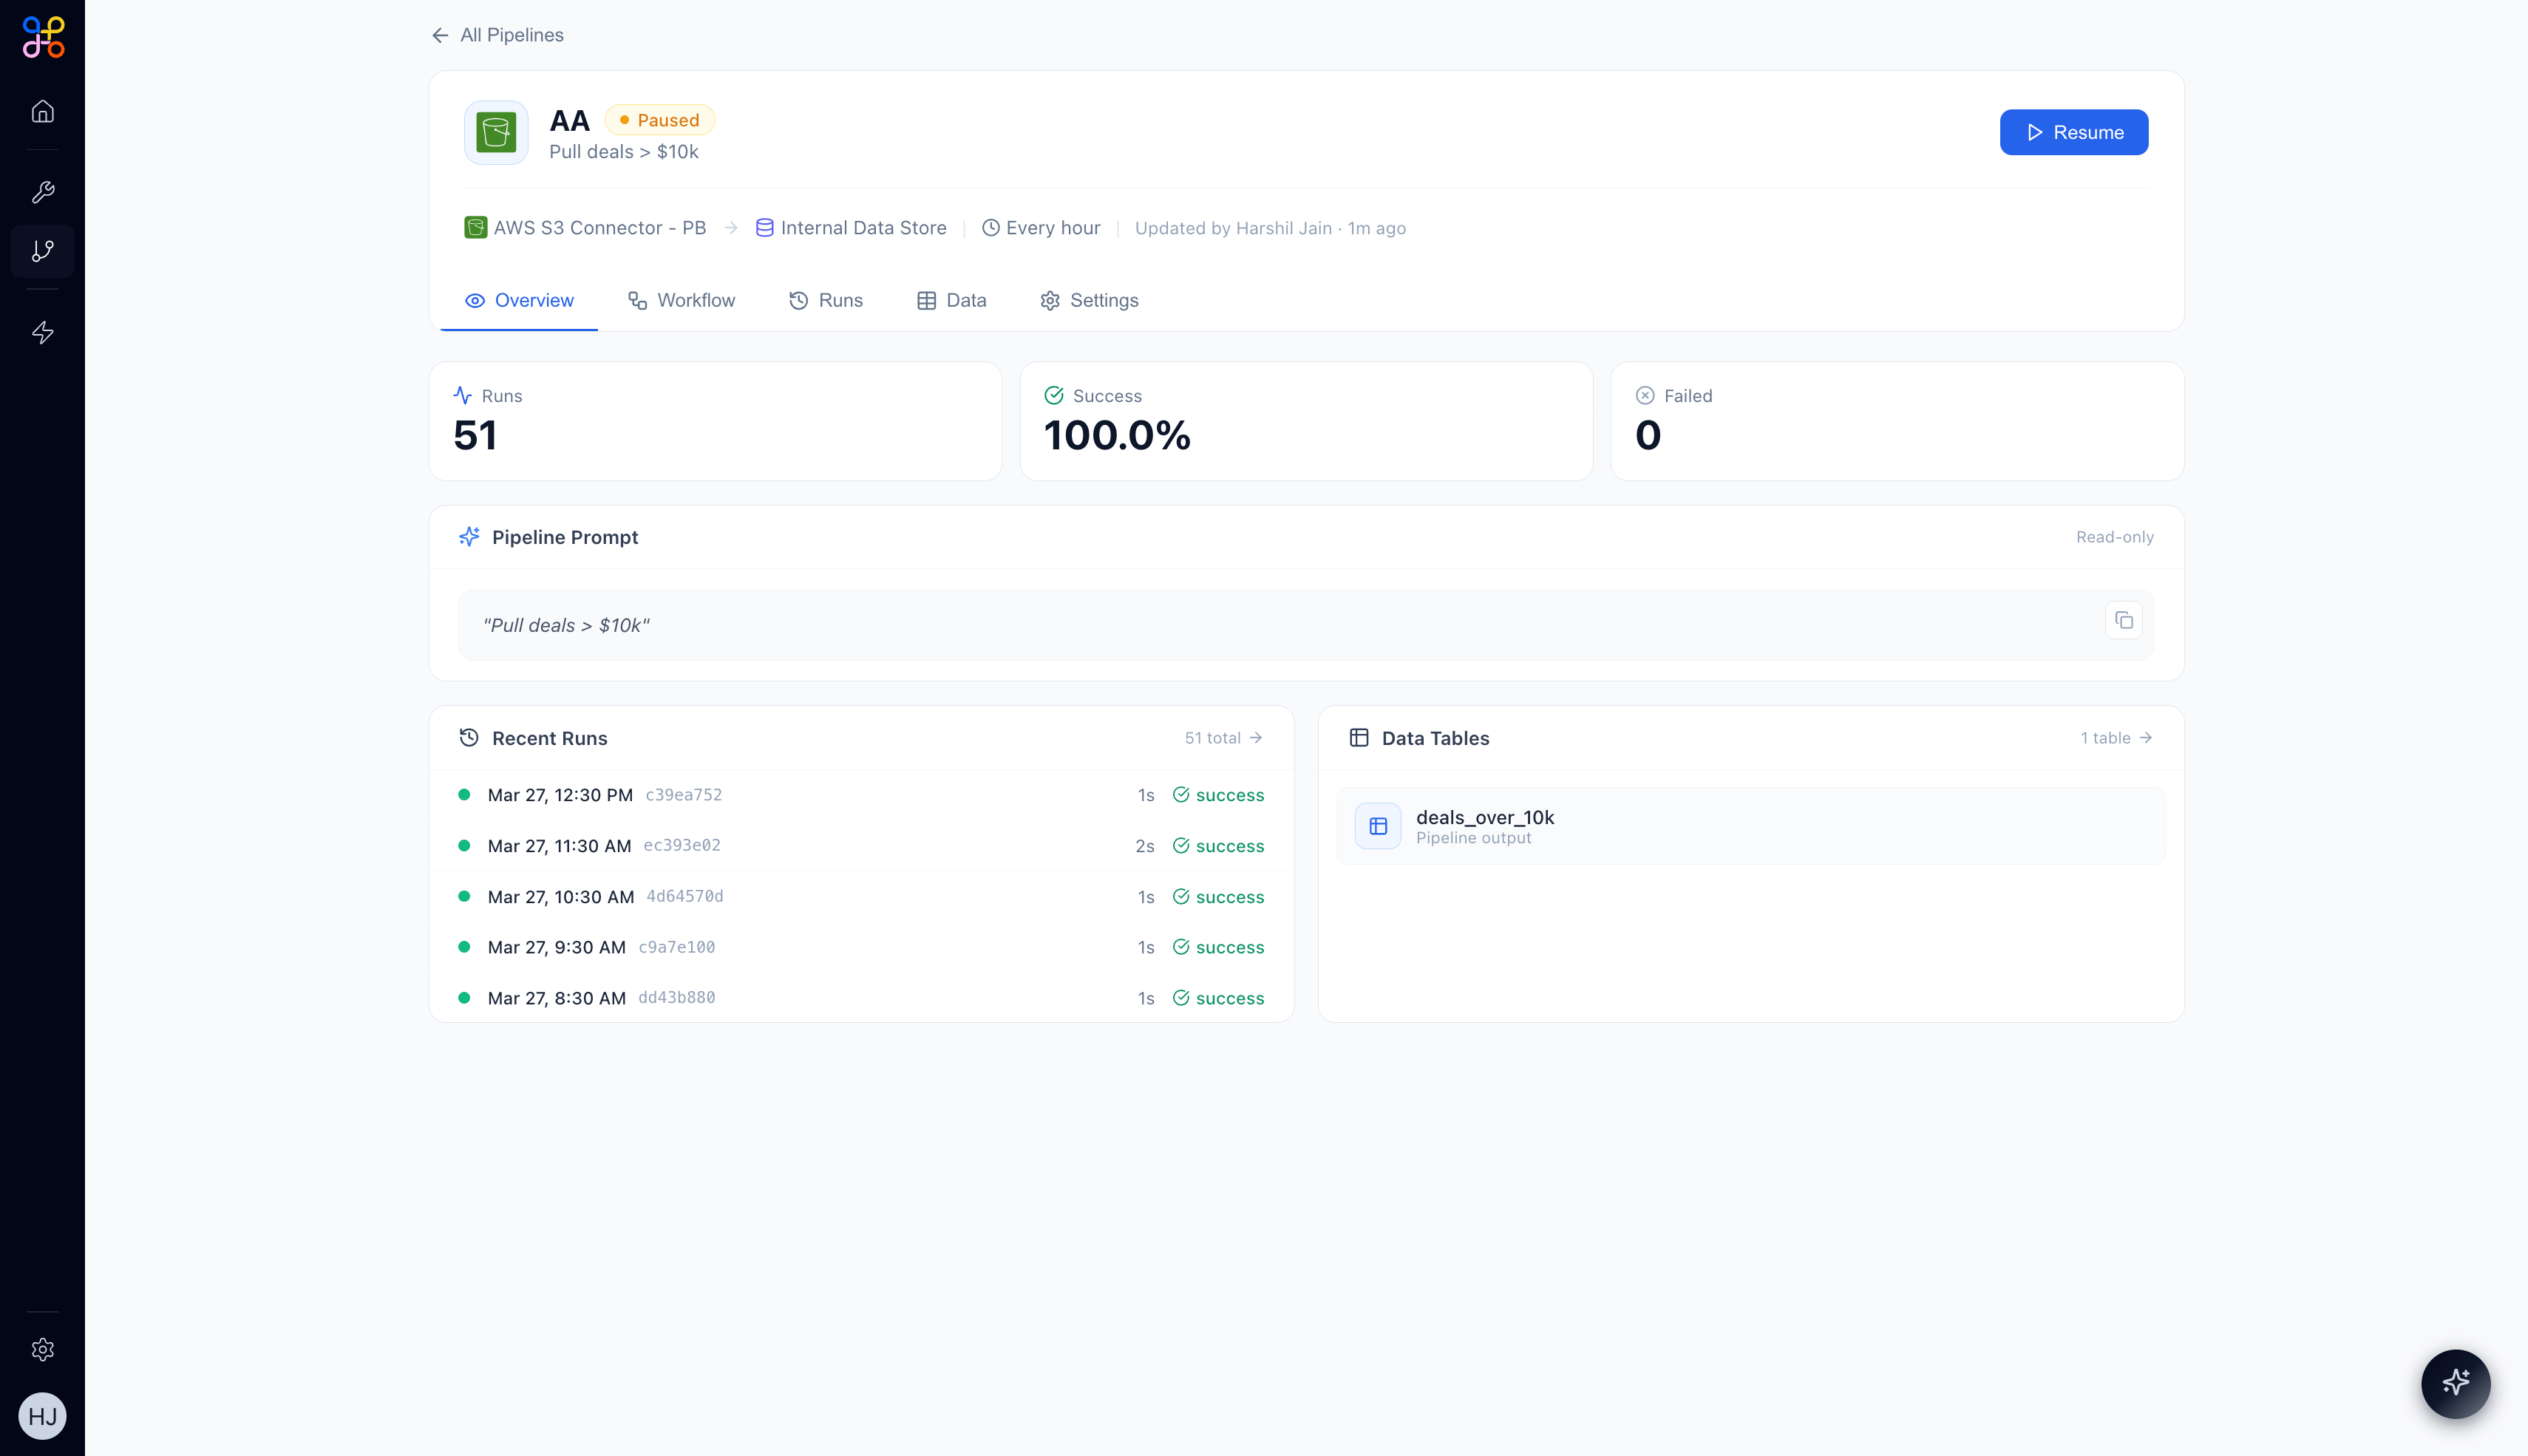 It shows:
* **Runs** — total number of executions
* **Success** — percentage of successful runs (e.g., 100.0%)
* **Failed** — number of failed runs
* **Pipeline Prompt** — the natural language description used to generate the workflow (read-only)
* **Recent Runs** — the last 5 runs with timestamps and status
* **Data Tables** — the named Pipeline Outcomes produced by this pipeline
***
## The Workflow Tab
The **Workflow** tab shows the pipeline's logic as a visual directed graph.
It shows:
* **Runs** — total number of executions
* **Success** — percentage of successful runs (e.g., 100.0%)
* **Failed** — number of failed runs
* **Pipeline Prompt** — the natural language description used to generate the workflow (read-only)
* **Recent Runs** — the last 5 runs with timestamps and status
* **Data Tables** — the named Pipeline Outcomes produced by this pipeline
***
## The Workflow Tab
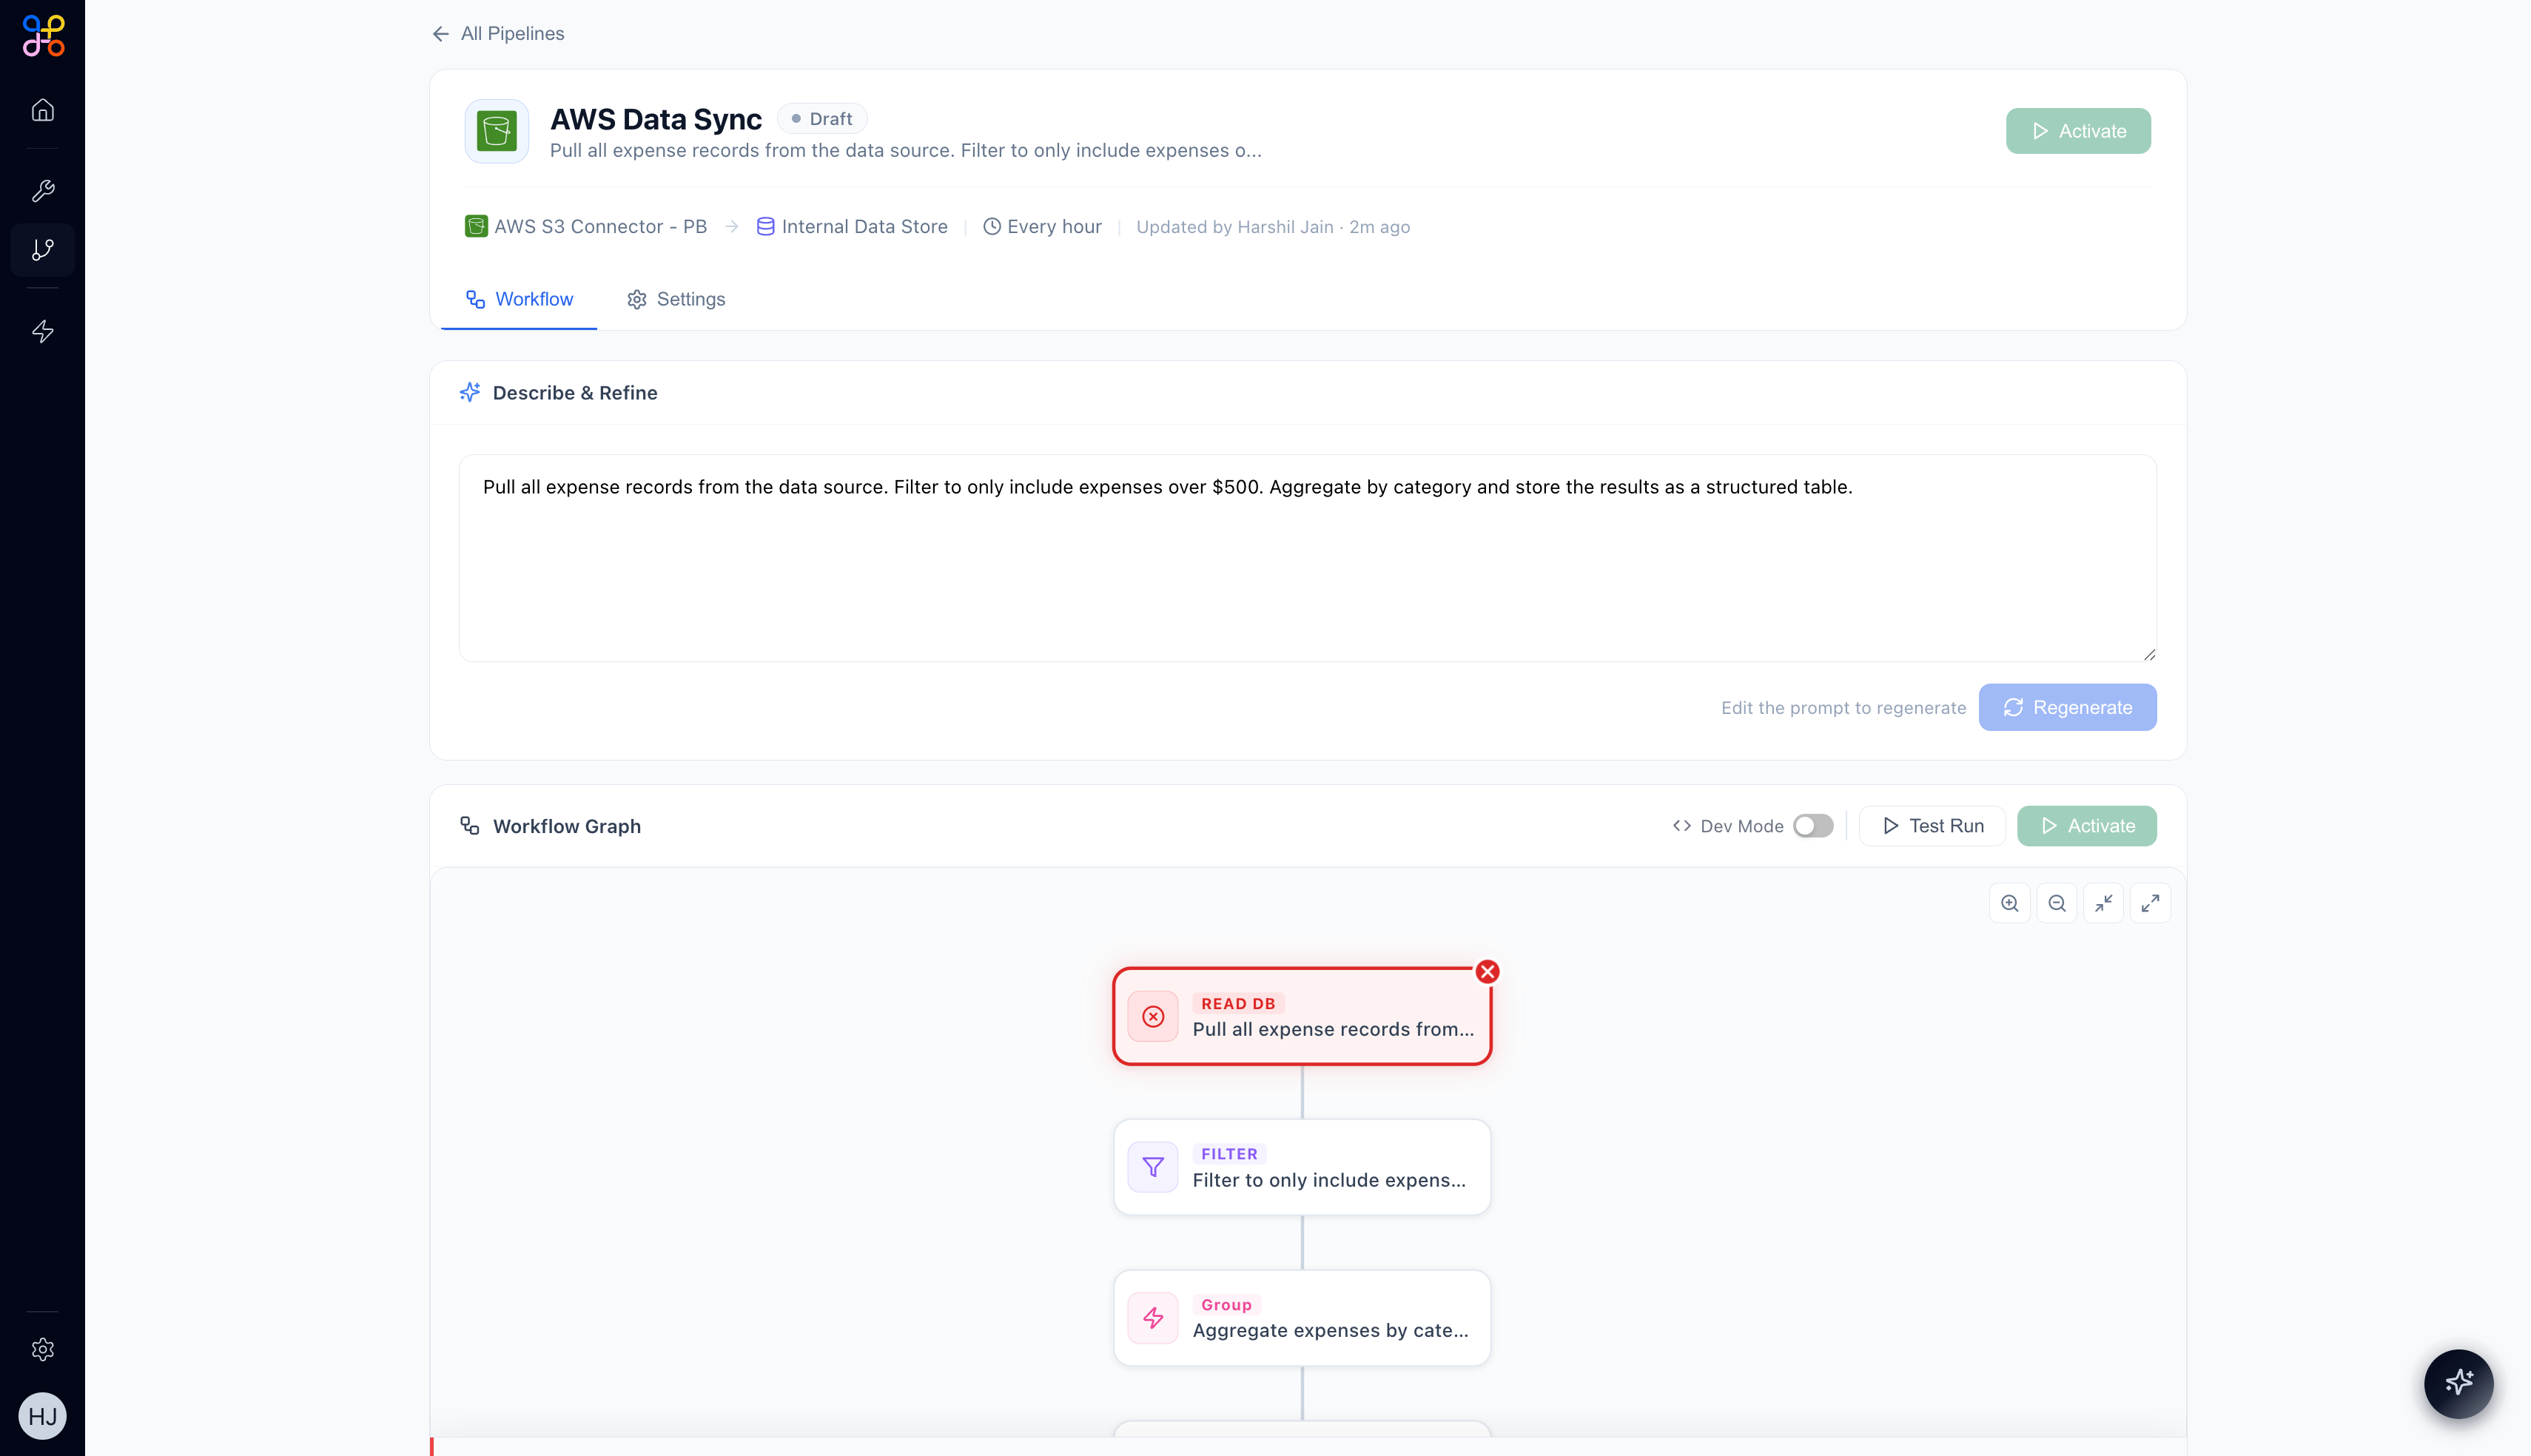
The **Workflow** tab shows the pipeline's logic as a visual directed graph.
 ### Pipeline Prompt
The top section shows the natural language description used to generate (and optionally regenerate) the workflow. In Draft state this is editable; in Active/Paused state it is read-only.
### Workflow Graph
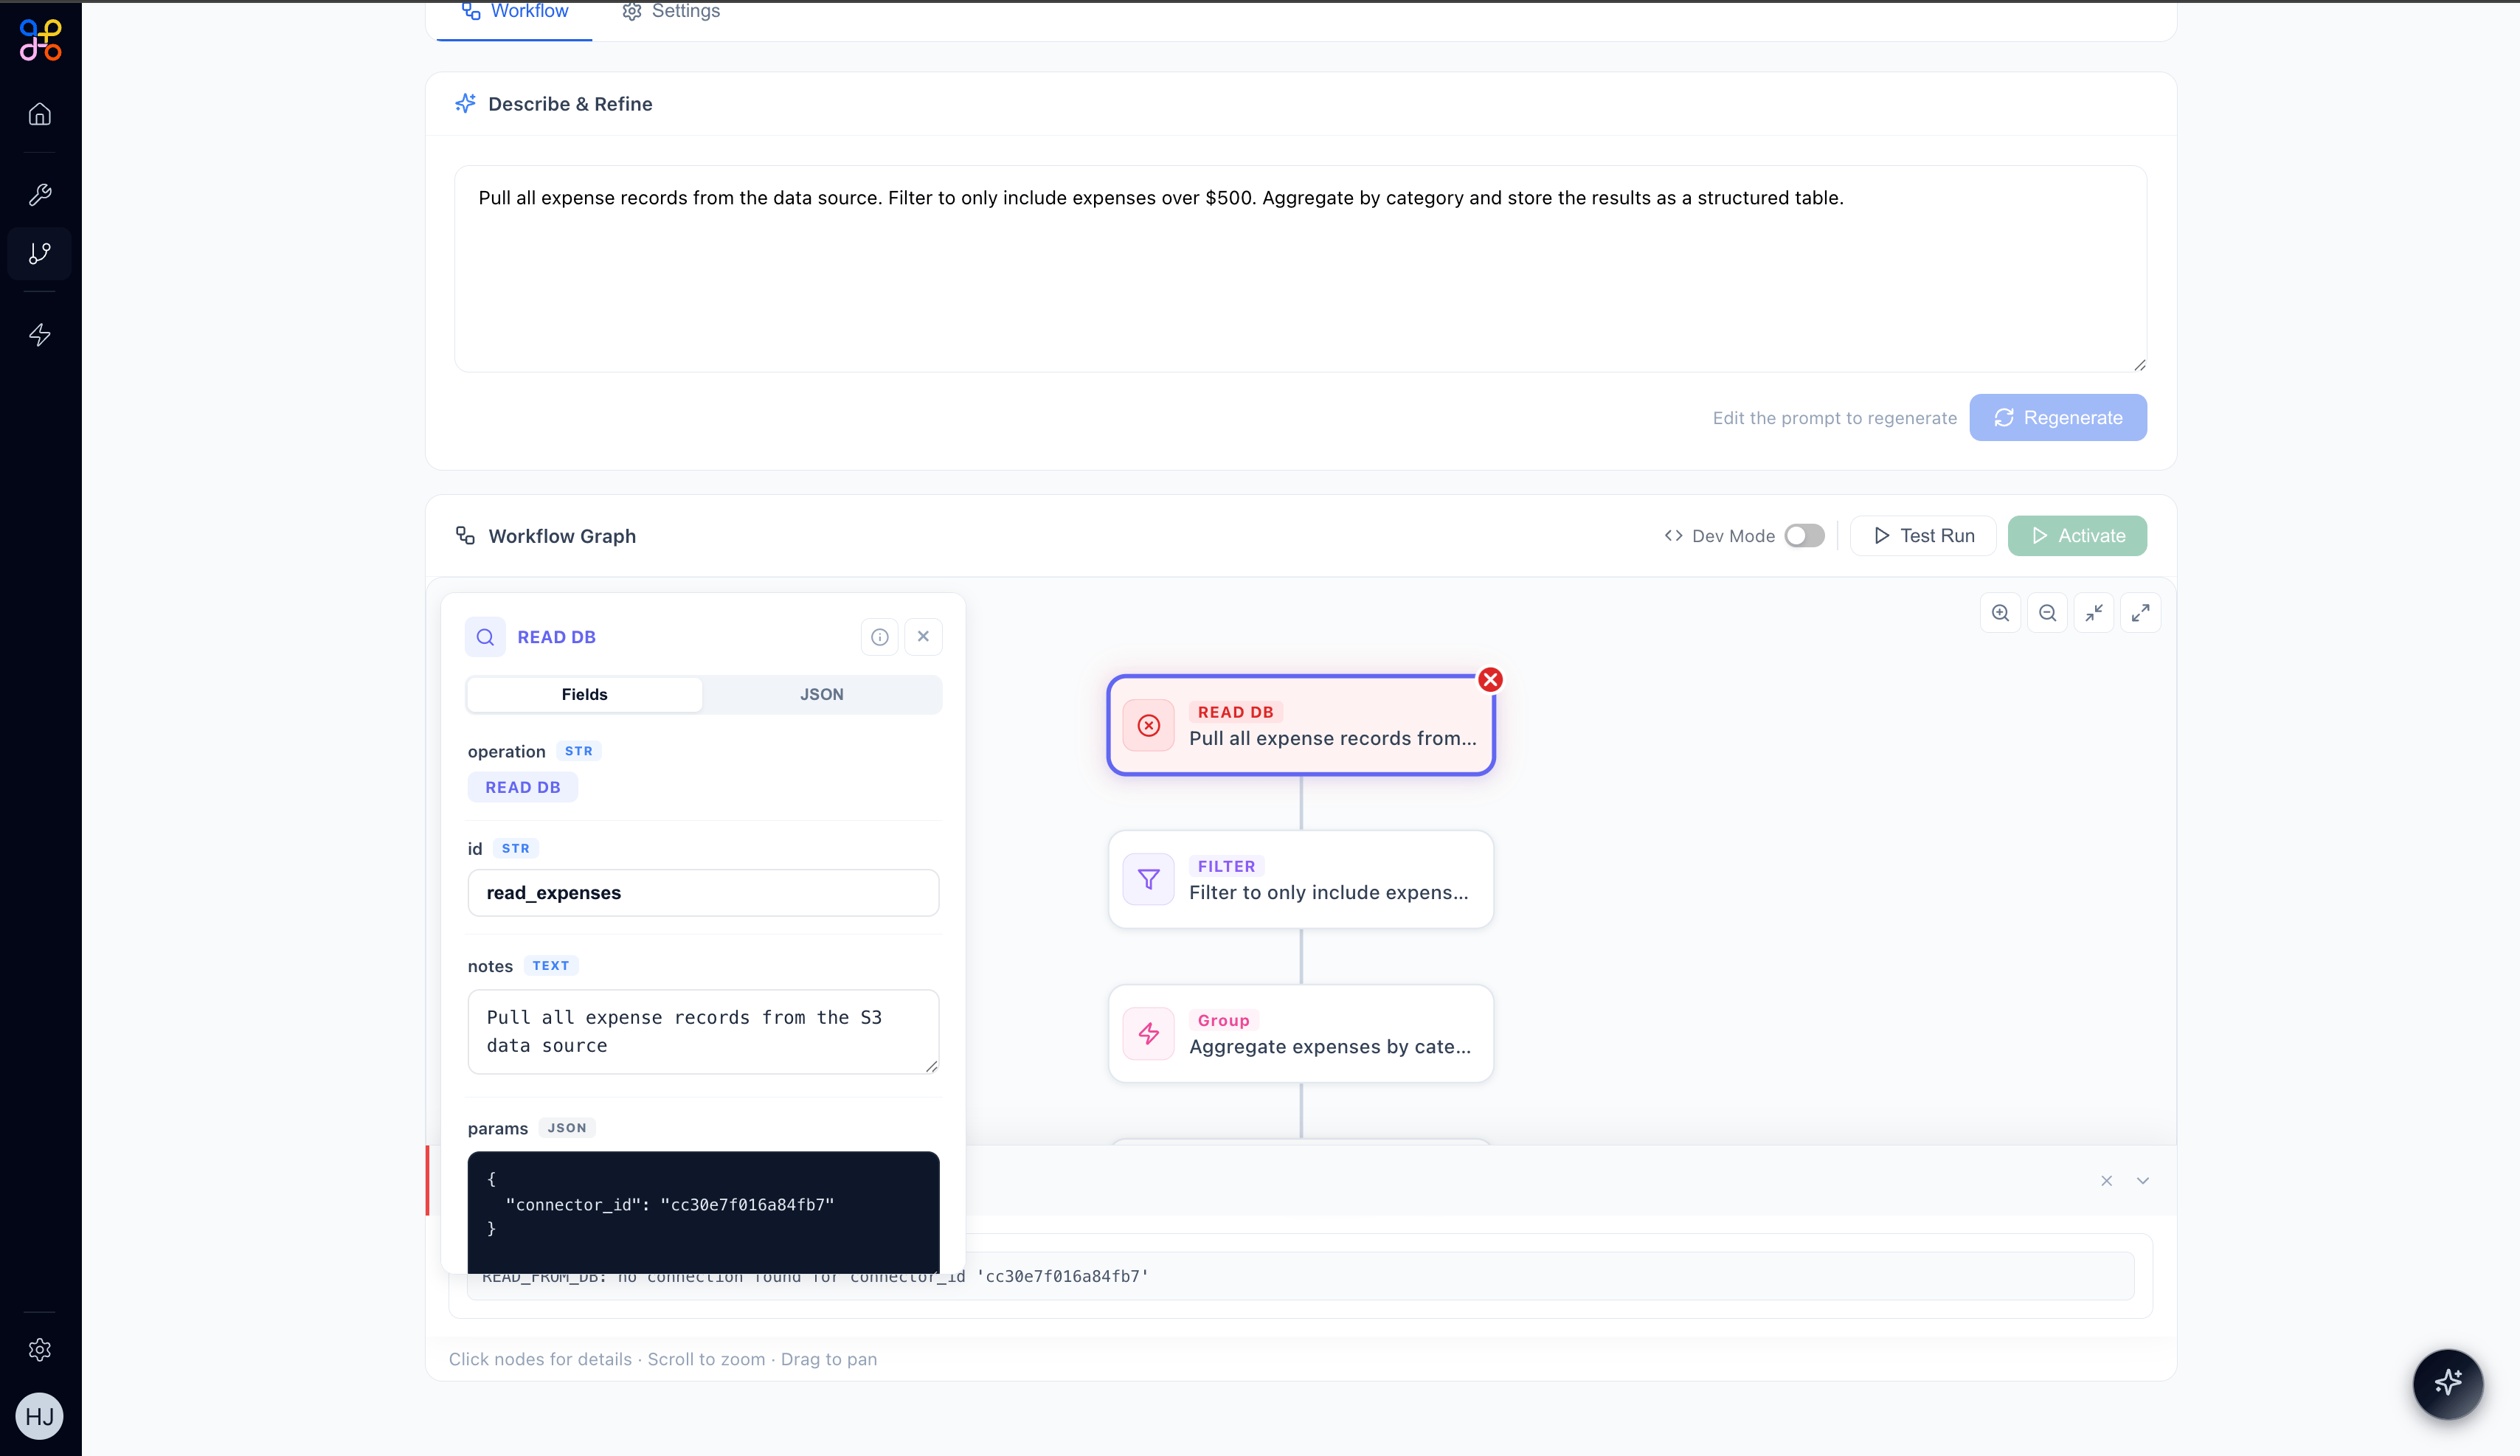
The graph displays every step of the pipeline as a connected sequence of nodes. Nodes are color-coded by type:
| Node Type | Color | Purpose |
| ------------- | ----------- | ----------------------------------------------------- |
| **TOOL** | Purple | Calls an external tool to fetch or act on data |
| **READ DB** | Blue | Reads records from a connected database or data store |
| **TRANSFORM** | Teal | Reshapes, renames, or processes data fields |
| **FILTER** | Pink | Applies conditional logic to include/exclude records |
| **GROUP** | Pink/Accent | Groups and aggregates records (sum, count, etc.) |
| **WRITE** | Green | Writes the final output to the Internal Data Store |
**Clicking a node** opens a detail panel showing its configuration in Fields view or raw JSON view.
### Pipeline Prompt
The top section shows the natural language description used to generate (and optionally regenerate) the workflow. In Draft state this is editable; in Active/Paused state it is read-only.
### Workflow Graph
The graph displays every step of the pipeline as a connected sequence of nodes. Nodes are color-coded by type:
| Node Type | Color | Purpose |
| ------------- | ----------- | ----------------------------------------------------- |
| **TOOL** | Purple | Calls an external tool to fetch or act on data |
| **READ DB** | Blue | Reads records from a connected database or data store |
| **TRANSFORM** | Teal | Reshapes, renames, or processes data fields |
| **FILTER** | Pink | Applies conditional logic to include/exclude records |
| **GROUP** | Pink/Accent | Groups and aggregates records (sum, count, etc.) |
| **WRITE** | Green | Writes the final output to the Internal Data Store |
**Clicking a node** opens a detail panel showing its configuration in Fields view or raw JSON view.
 ### Controls
* **Dev Mode toggle** — switch to a raw view of the workflow definition (for advanced inspection)
* **Test Run** — execute the pipeline immediately against real data (in Draft or Active state)
* **Activate / Pause / Resume** — change the pipeline's running state
Use the **Test Run** feature after any change to the pipeline description to validate output before it runs on schedule.
***
## The Runs Tab
The **Runs** tab provides a full history of all pipeline executions.
### Controls
* **Dev Mode toggle** — switch to a raw view of the workflow definition (for advanced inspection)
* **Test Run** — execute the pipeline immediately against real data (in Draft or Active state)
* **Activate / Pause / Resume** — change the pipeline's running state
Use the **Test Run** feature after any change to the pipeline description to validate output before it runs on schedule.
***
## The Runs Tab
The **Runs** tab provides a full history of all pipeline executions.
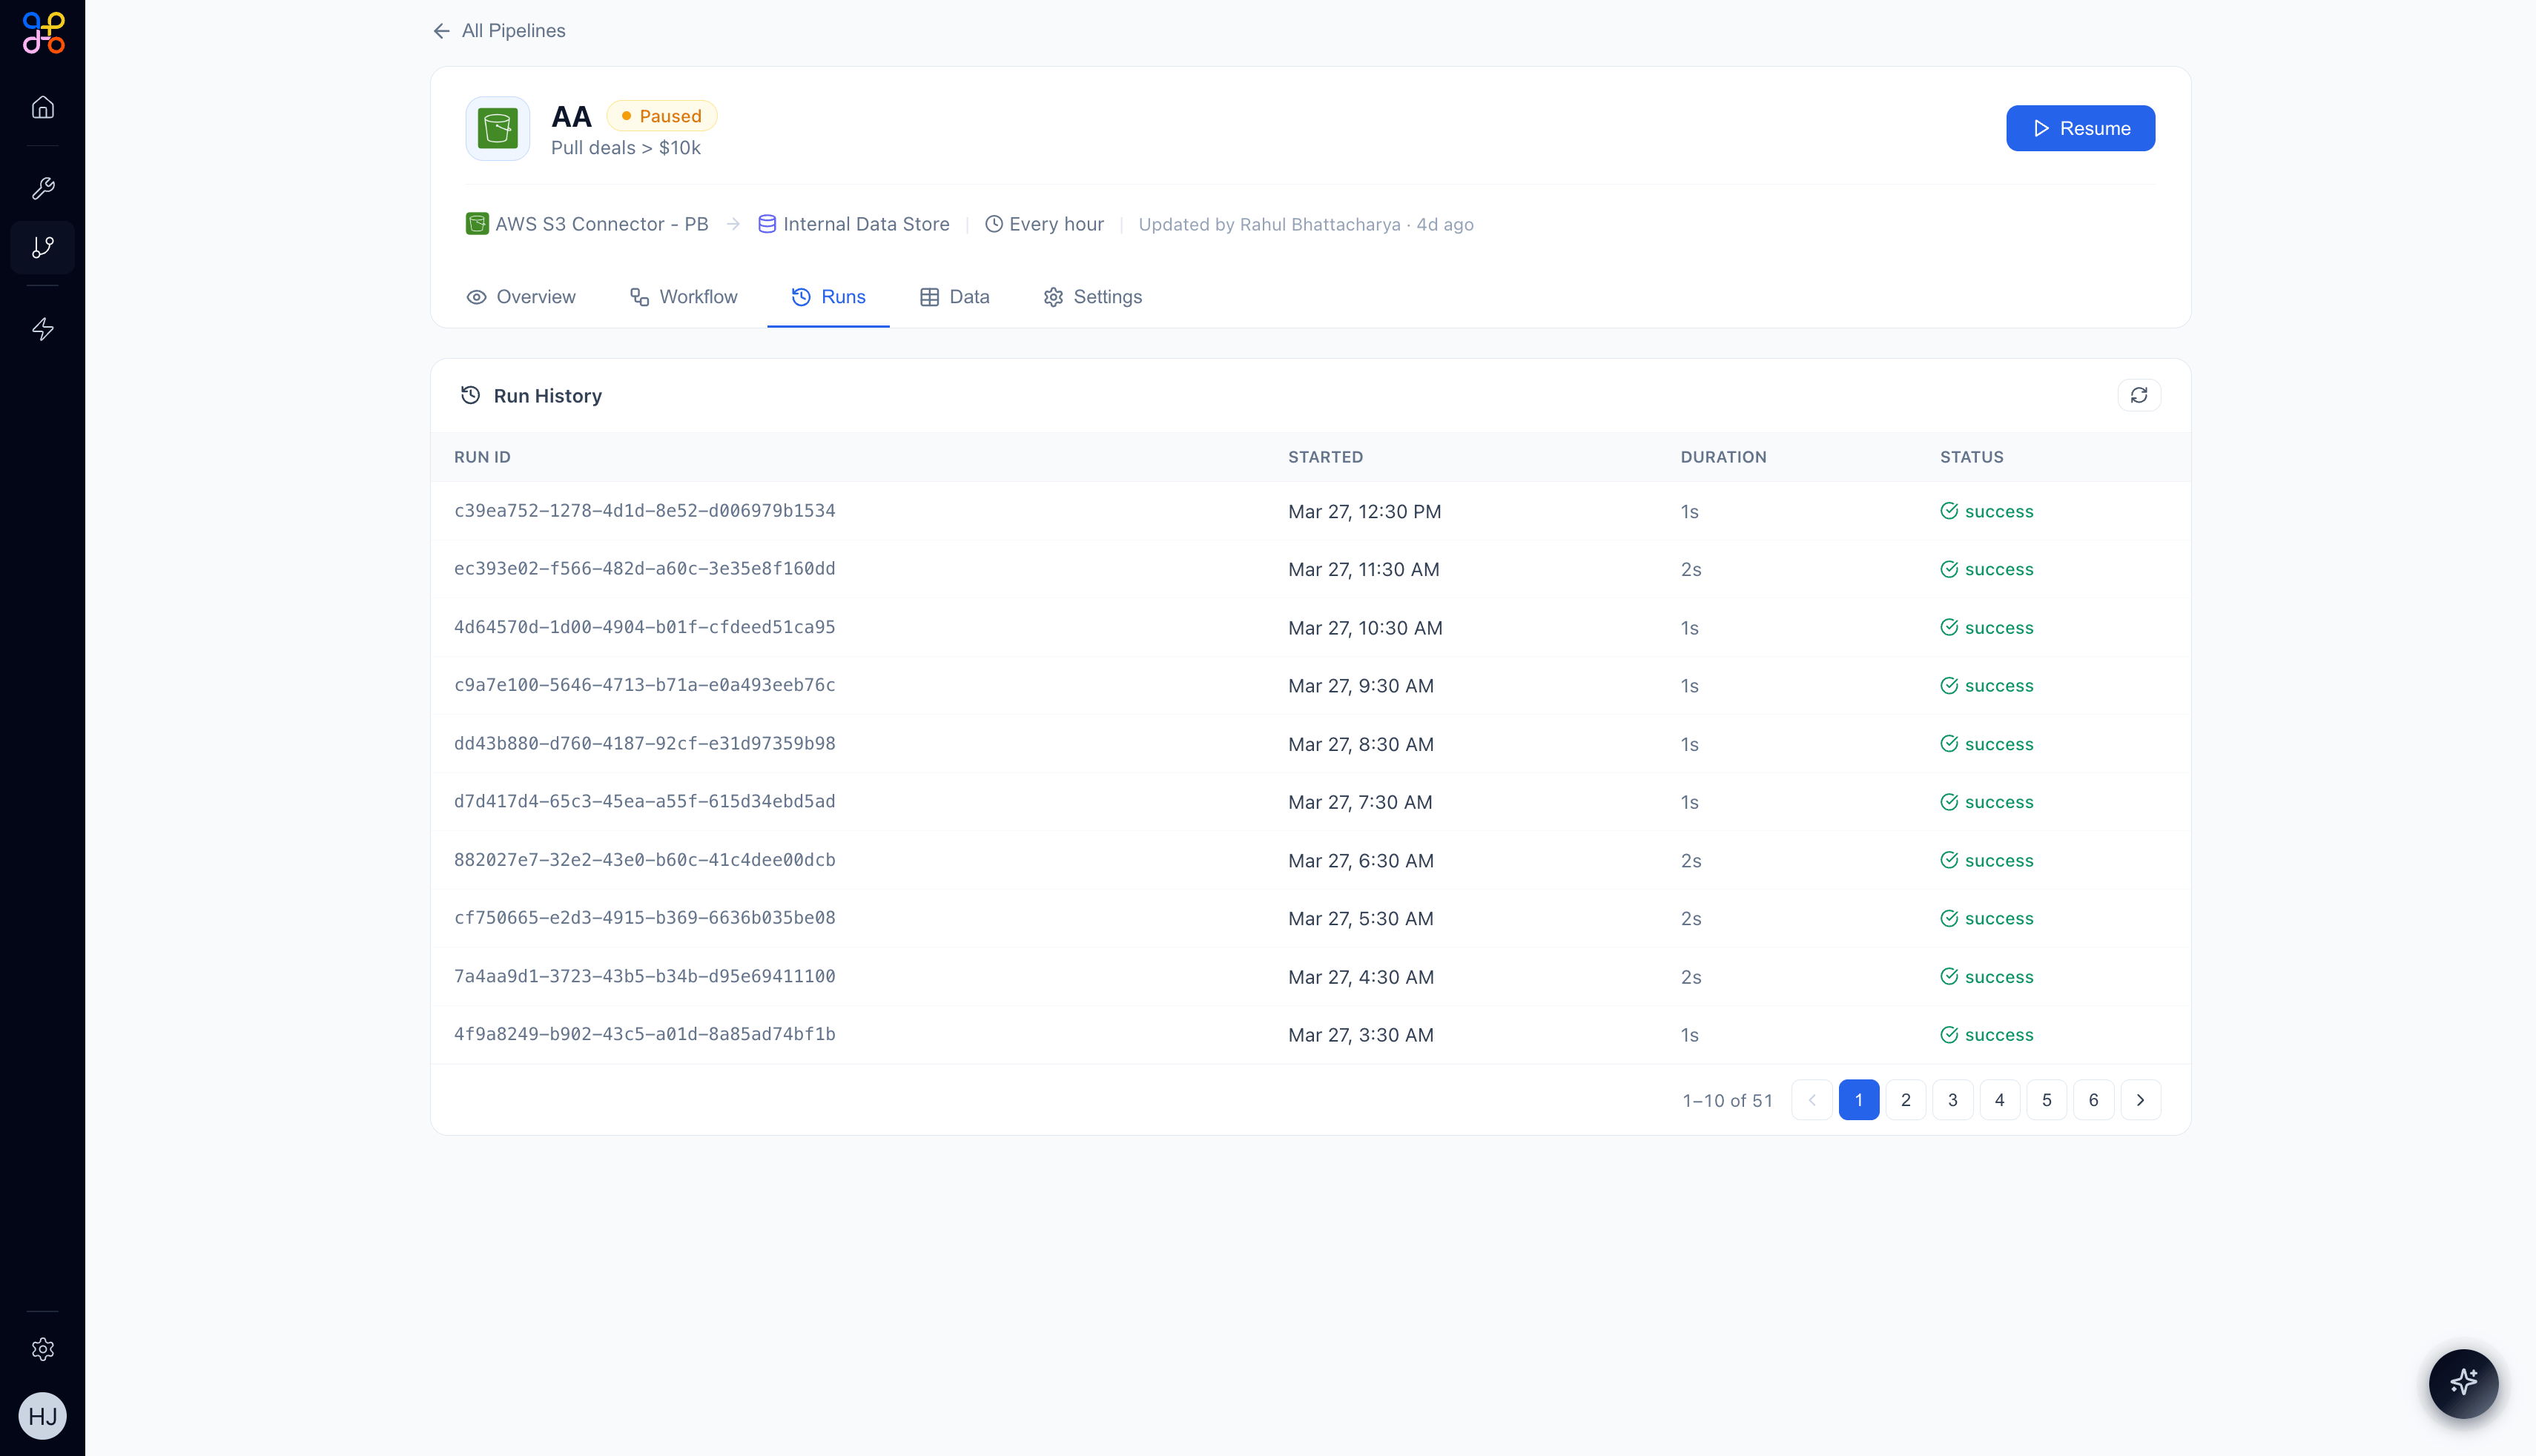 Each row in the **Run History** table shows:
* **Run ID** — unique identifier for the execution
* **Started** — date and time the run began
* **Duration** — how long the run took (typically 1–3 seconds for well-formed pipelines)
* **Status** — `success` or `failed`
Runs are paginated (10 per page). Use the page controls at the bottom to navigate through history.
The pipeline overview stat card shows total runs, success rate, and failure count. If your success rate drops below 100%, investigate recent runs for errors and check that your connector credentials are still valid.
***
## The Data Tab
The **Data** tab shows the current Pipeline Outcomes — the structured output tables produced by the most recent successful run.
Each row in the **Run History** table shows:
* **Run ID** — unique identifier for the execution
* **Started** — date and time the run began
* **Duration** — how long the run took (typically 1–3 seconds for well-formed pipelines)
* **Status** — `success` or `failed`
Runs are paginated (10 per page). Use the page controls at the bottom to navigate through history.
The pipeline overview stat card shows total runs, success rate, and failure count. If your success rate drops below 100%, investigate recent runs for errors and check that your connector credentials are still valid.
***
## The Data Tab
The **Data** tab shows the current Pipeline Outcomes — the structured output tables produced by the most recent successful run.
 Each outcome table is labeled with its name (e.g., `deals_over_10k`, `aggregated_expenses`) and shows records as rows. If the pipeline has never run or is paused, the message **"No records yet — Records will appear here after the pipeline processes data"** is shown.
***
## The Settings Tab
The **Settings** tab gives you full control over the pipeline configuration.
Each outcome table is labeled with its name (e.g., `deals_over_10k`, `aggregated_expenses`) and shows records as rows. If the pipeline has never run or is paused, the message **"No records yet — Records will appear here after the pipeline processes data"** is shown.
***
## The Settings Tab
The **Settings** tab gives you full control over the pipeline configuration.
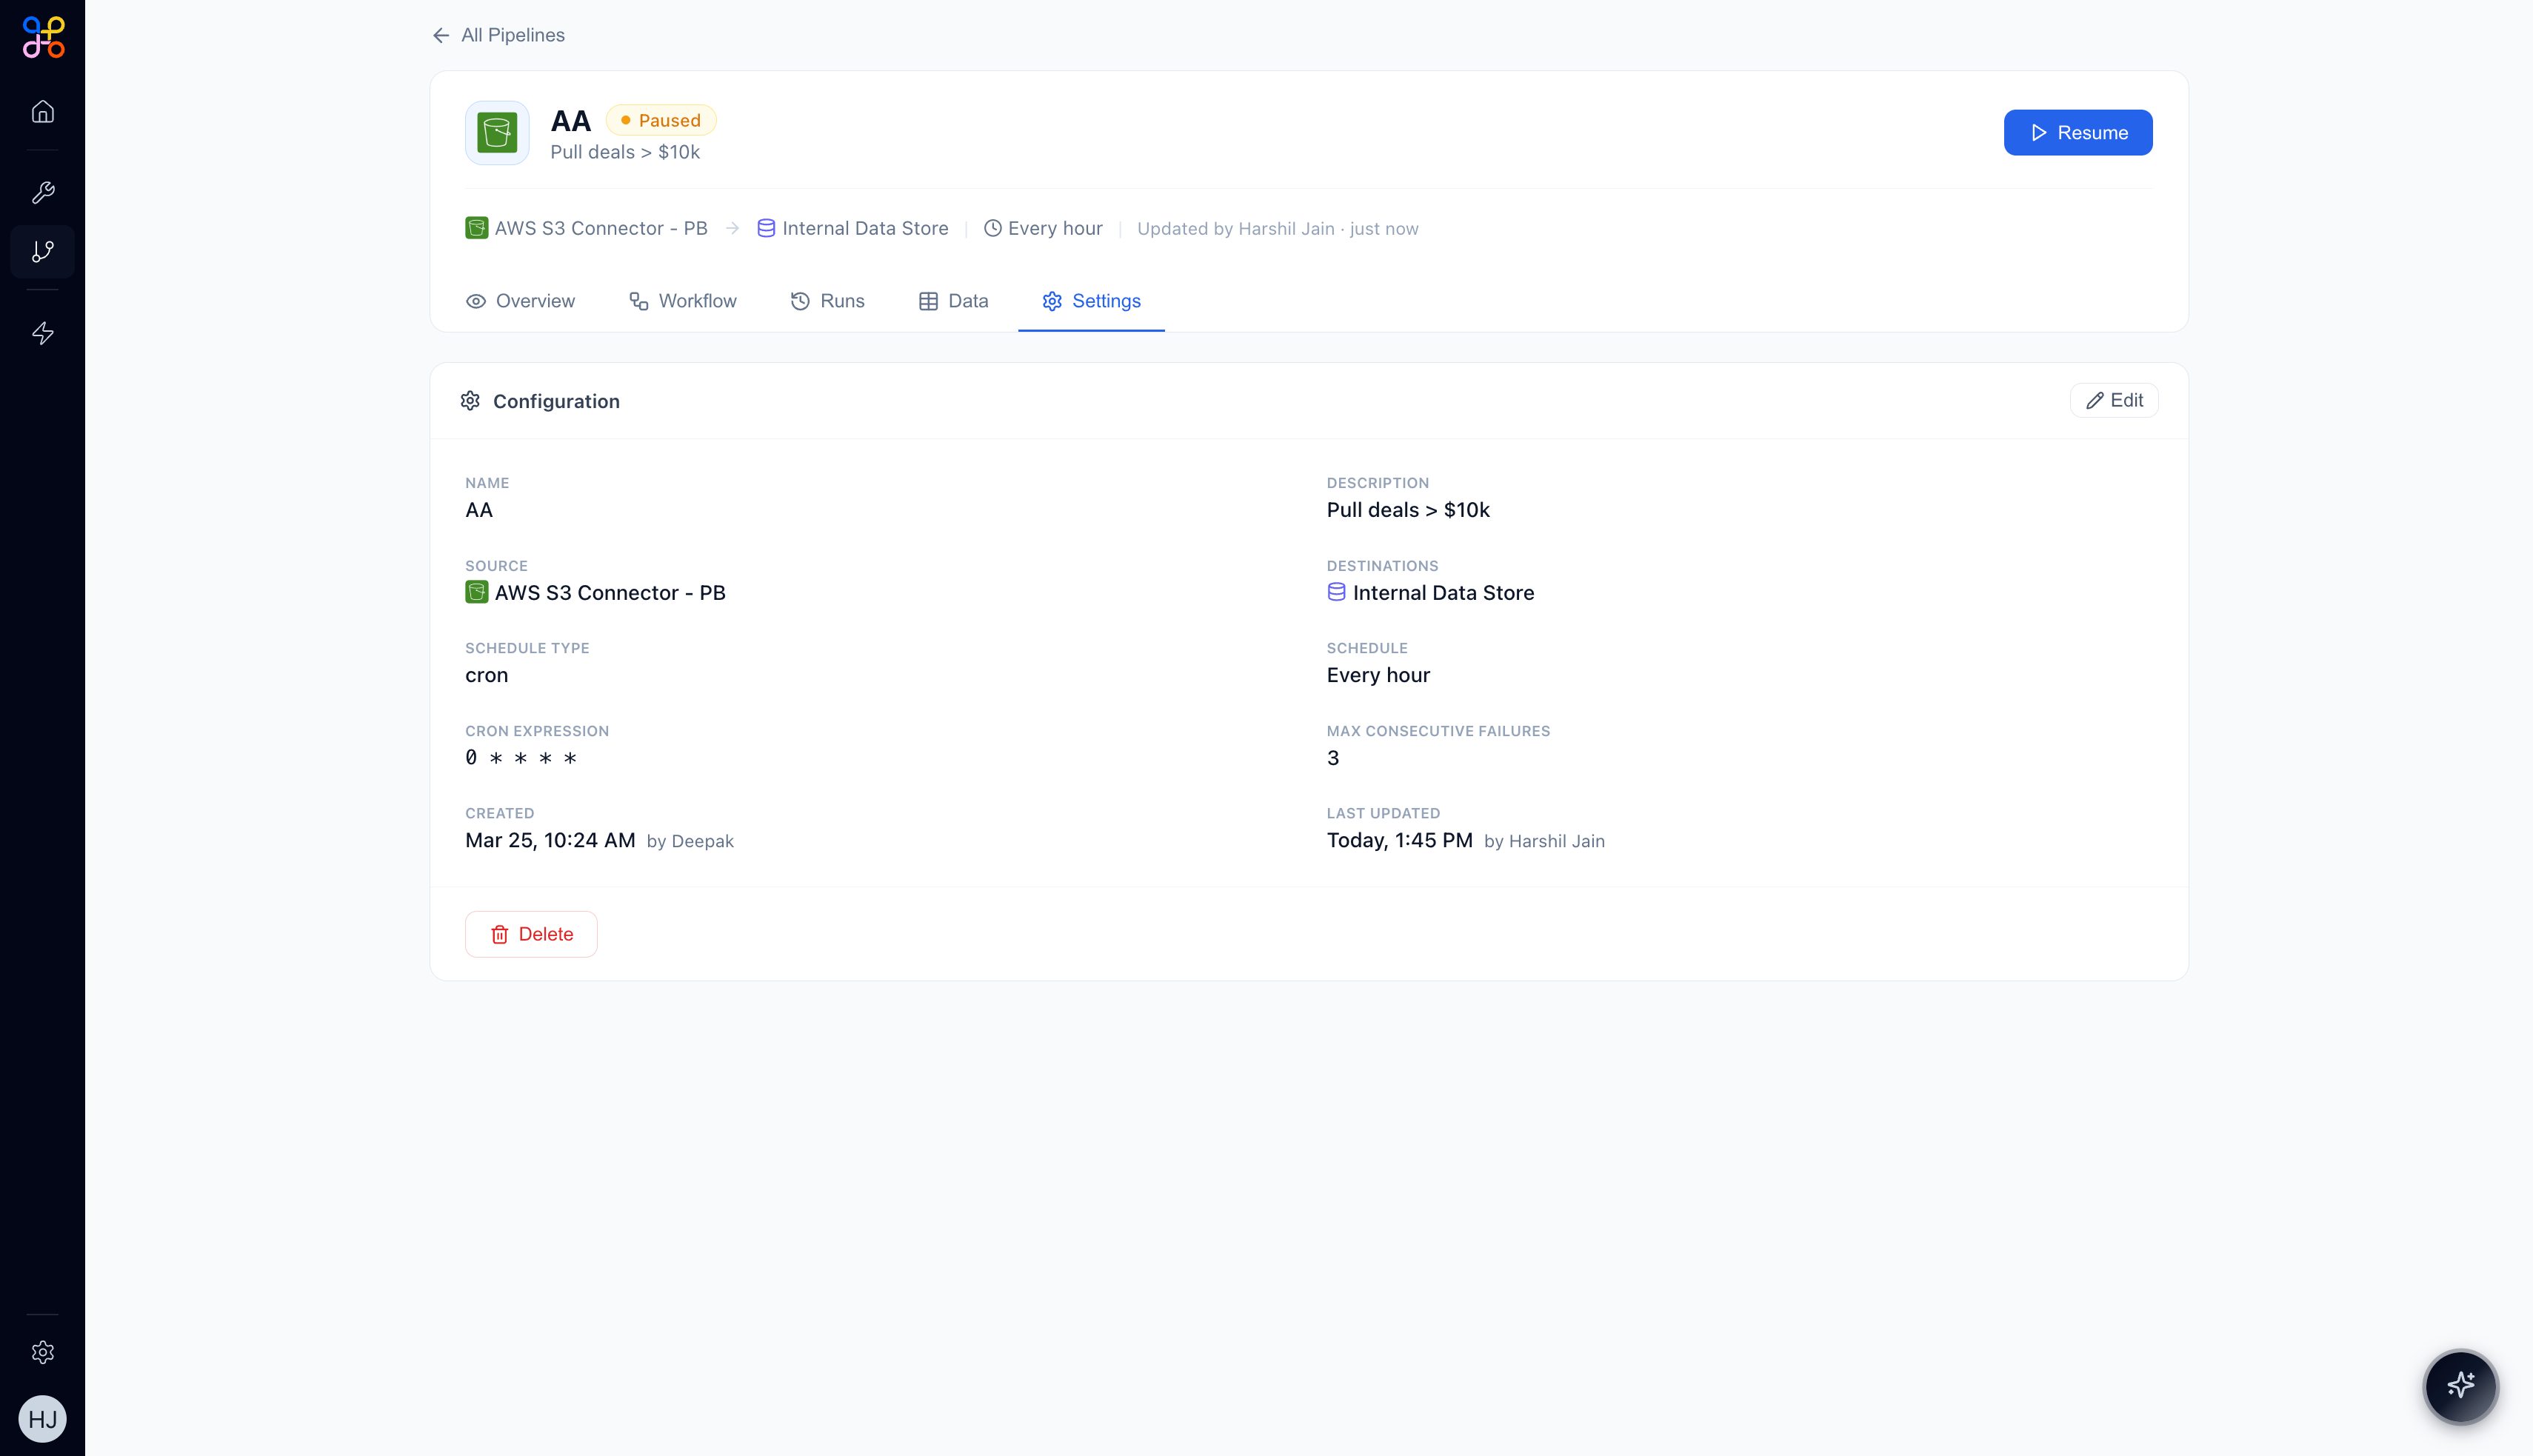 ### Configuration Fields
| Field | Description |
| ---------------------------- | ------------------------------------------------------------------ |
| **Name** | The pipeline's display name |
| **Description** | The natural language description / pipeline prompt |
| **Source** | The Connector providing input data |
| **Destinations** | Where output data is stored (always Internal Data Store) |
| **Schedule Type** | Manual or Cron |
| **Cron Expression** | The cron schedule (e.g., `0 9 * * *` = daily at 9:00 AM UTC) |
| **Schedule** | Human-readable schedule (e.g., "At 09:00 AM (UTC)") |
| **Max Consecutive Failures** | Number of failed runs before the pipeline auto-pauses (default: 3) |
| **Created** | Timestamp and user who created the pipeline |
| **Last Updated** | Timestamp and user of the most recent change |
### Auto-Pause on Failure
The **Max Consecutive Failures** setting (default: 3) automatically pauses the pipeline if it fails repeatedly. This prevents a misconfigured pipeline from silently running and producing bad data.
If your pipeline auto-pauses due to consecutive failures, check the Runs tab for error details, fix the root cause (usually a connector issue or schema change), then click **Resume**.
***
## Scheduling Options
Pipelines support five scheduling modes:
| Option | Cron equivalent | Typical use |
| ---------- | ------------------- | ---------------------------------------------------------------- |
| **Manual** | (none) | On-demand runs, testing, one-off jobs |
| **Hourly** | `0 * * * *` | Live CRM data, monitoring dashboards |
| **Daily** | `0 9 * * *` | Financial reports, daily summaries |
| **Weekly** | `0 9 * * 1` | Weekly rollups, lower-frequency aggregations |
| **Custom** | Any cron expression | Specific timing requirements (e.g., every 15 min, weekdays only) |
***
## The Pipelines Overview Dashboard
At the top level of the Pipelines section, the **Overview** tab shows aggregate health metrics across all pipelines in your project.
### Configuration Fields
| Field | Description |
| ---------------------------- | ------------------------------------------------------------------ |
| **Name** | The pipeline's display name |
| **Description** | The natural language description / pipeline prompt |
| **Source** | The Connector providing input data |
| **Destinations** | Where output data is stored (always Internal Data Store) |
| **Schedule Type** | Manual or Cron |
| **Cron Expression** | The cron schedule (e.g., `0 9 * * *` = daily at 9:00 AM UTC) |
| **Schedule** | Human-readable schedule (e.g., "At 09:00 AM (UTC)") |
| **Max Consecutive Failures** | Number of failed runs before the pipeline auto-pauses (default: 3) |
| **Created** | Timestamp and user who created the pipeline |
| **Last Updated** | Timestamp and user of the most recent change |
### Auto-Pause on Failure
The **Max Consecutive Failures** setting (default: 3) automatically pauses the pipeline if it fails repeatedly. This prevents a misconfigured pipeline from silently running and producing bad data.
If your pipeline auto-pauses due to consecutive failures, check the Runs tab for error details, fix the root cause (usually a connector issue or schema change), then click **Resume**.
***
## Scheduling Options
Pipelines support five scheduling modes:
| Option | Cron equivalent | Typical use |
| ---------- | ------------------- | ---------------------------------------------------------------- |
| **Manual** | (none) | On-demand runs, testing, one-off jobs |
| **Hourly** | `0 * * * *` | Live CRM data, monitoring dashboards |
| **Daily** | `0 9 * * *` | Financial reports, daily summaries |
| **Weekly** | `0 9 * * 1` | Weekly rollups, lower-frequency aggregations |
| **Custom** | Any cron expression | Specific timing requirements (e.g., every 15 min, weekdays only) |
***
## The Pipelines Overview Dashboard
At the top level of the Pipelines section, the **Overview** tab shows aggregate health metrics across all pipelines in your project.
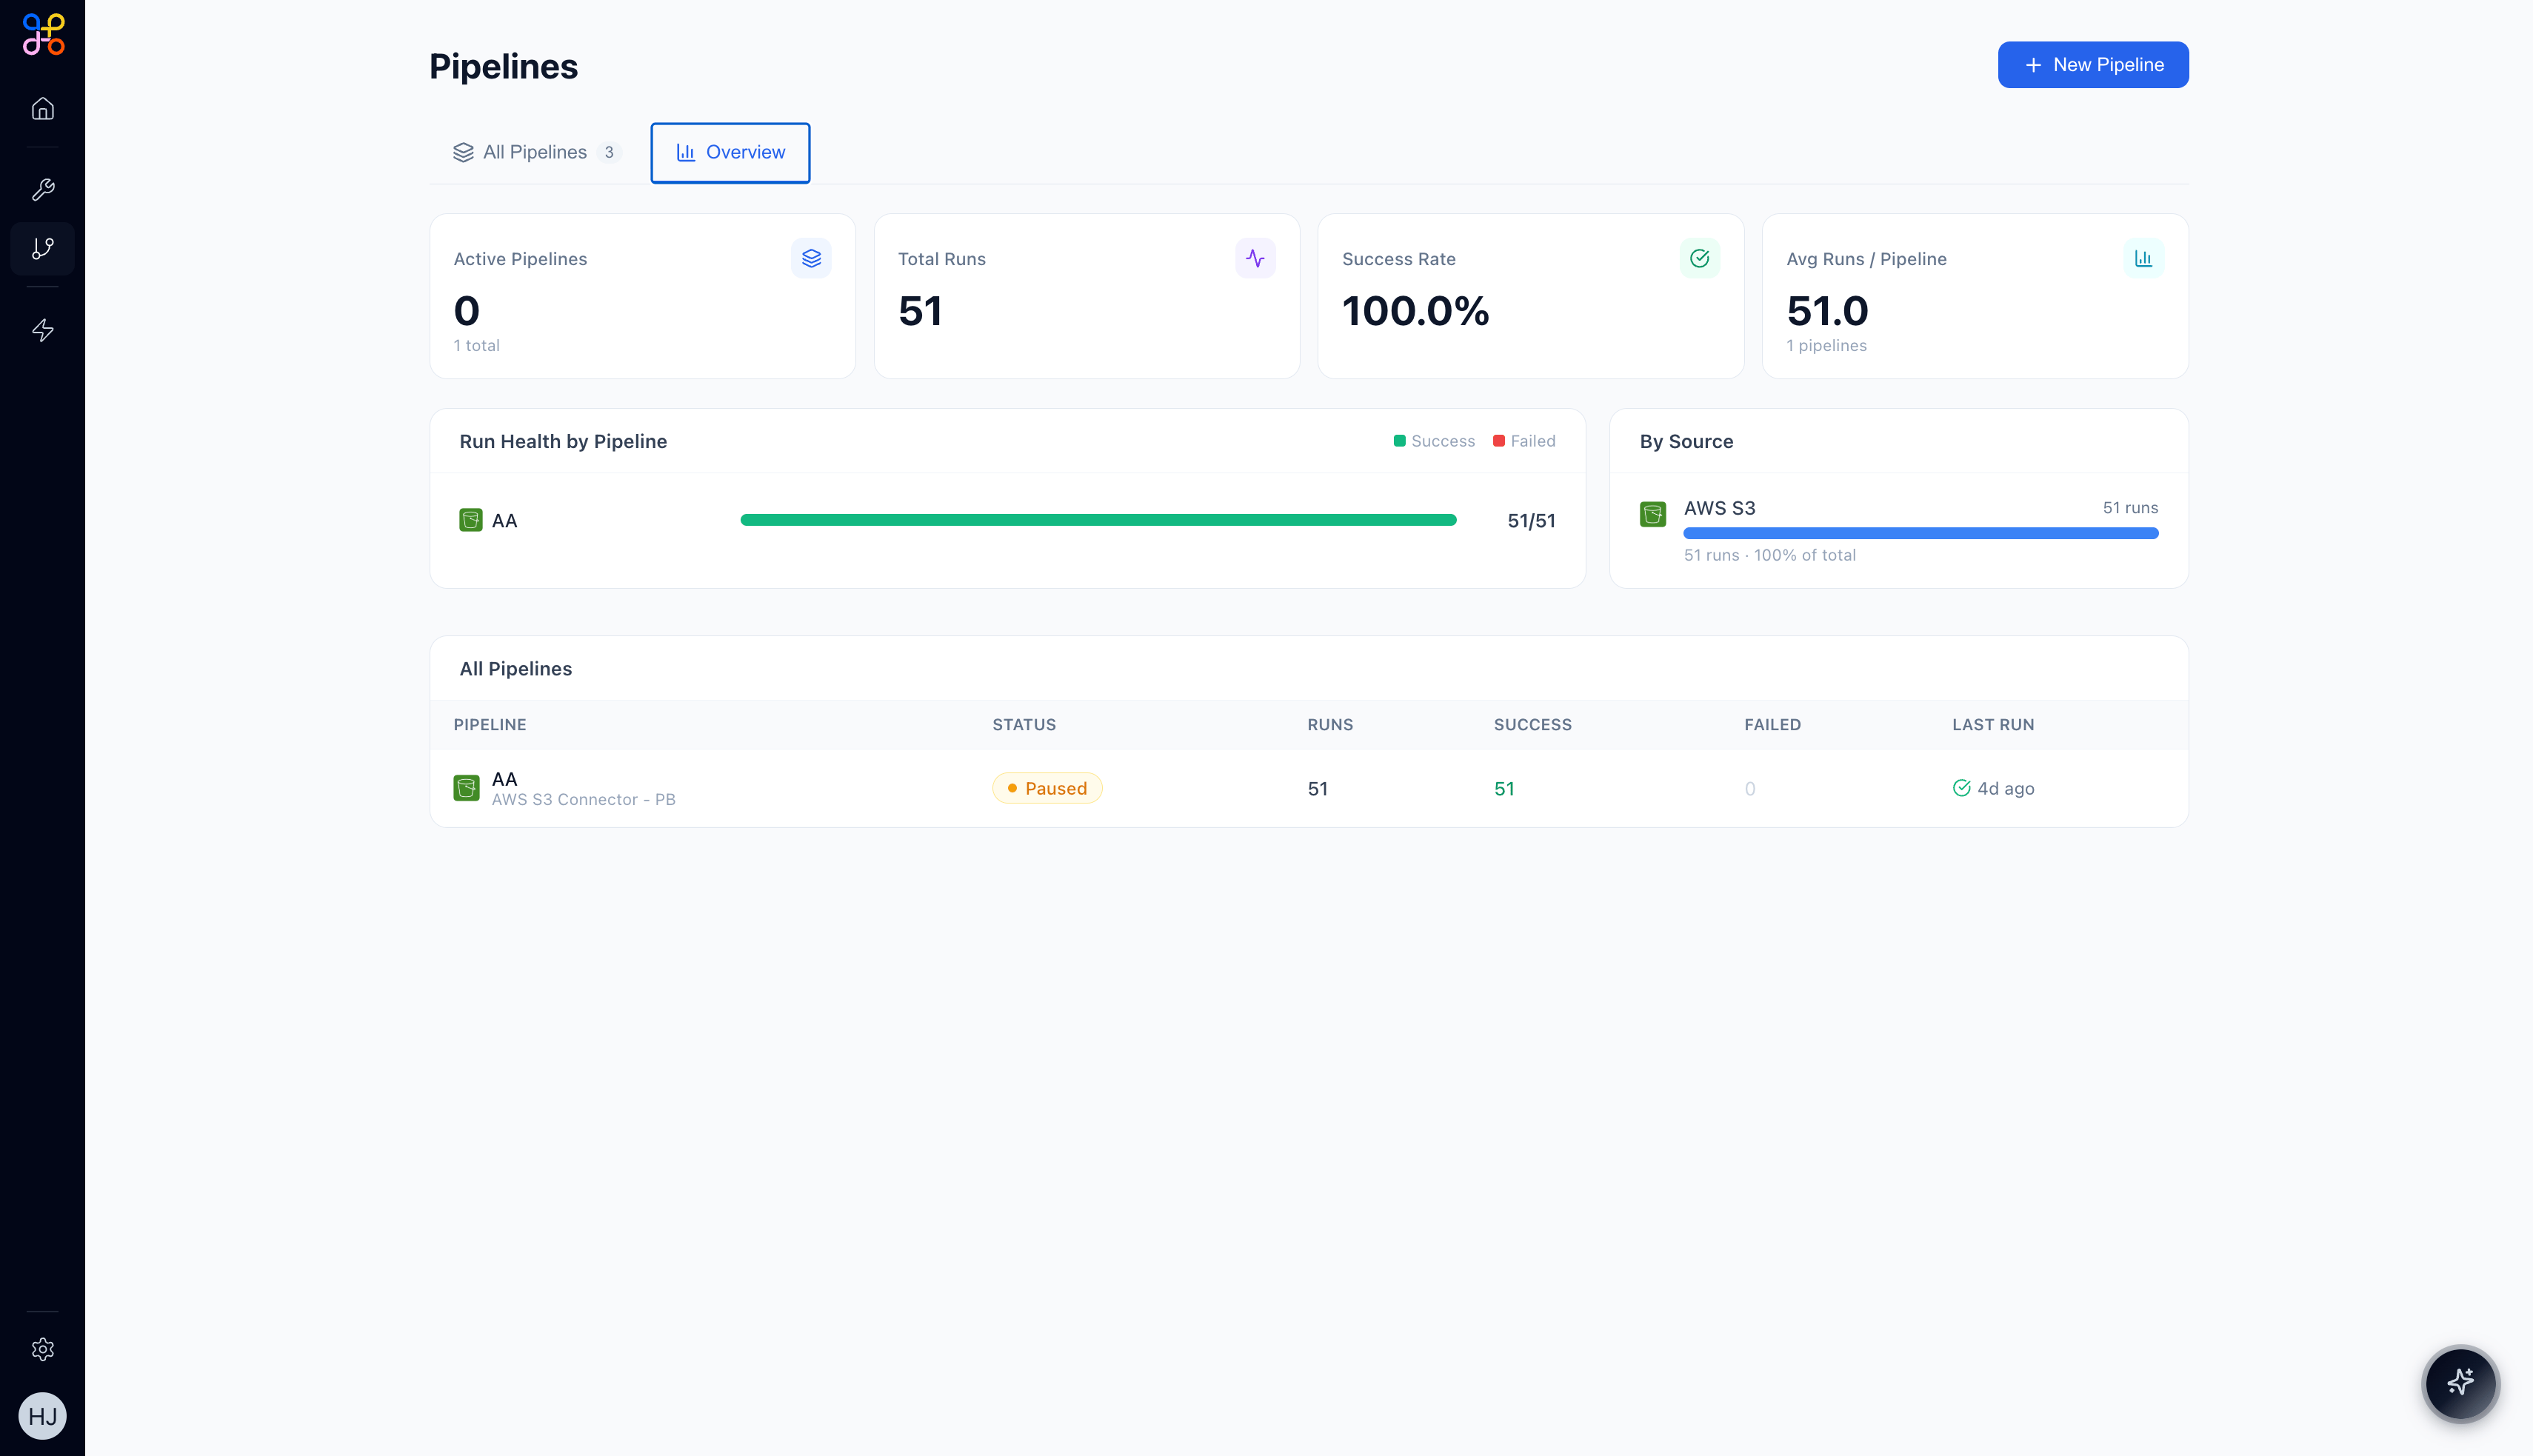 Metrics shown:
* **Active Pipelines** — how many are currently running (vs. total)
* **Total Runs** — all executions across all pipelines
* **Success Rate** — aggregate success percentage
* **Avg Runs / Pipeline** — average executions per pipeline
* **Run Health by Pipeline** — bar chart per pipeline showing success vs. failure ratio
* **By Source** — breakdown of runs by connector type
***
## Next Steps
* [Using Pipelines in Experiences](/essentials/using-pipelines-in-experiences) — display Pipeline data in HITL dashboards
* [Best Practices](/essentials/pipelines-best-practices) — tips for building reliable, maintainable pipelines
Metrics shown:
* **Active Pipelines** — how many are currently running (vs. total)
* **Total Runs** — all executions across all pipelines
* **Success Rate** — aggregate success percentage
* **Avg Runs / Pipeline** — average executions per pipeline
* **Run Health by Pipeline** — bar chart per pipeline showing success vs. failure ratio
* **By Source** — breakdown of runs by connector type
***
## Next Steps
* [Using Pipelines in Experiences](/essentials/using-pipelines-in-experiences) — display Pipeline data in HITL dashboards
* [Best Practices](/essentials/pipelines-best-practices) — tips for building reliable, maintainable pipelines