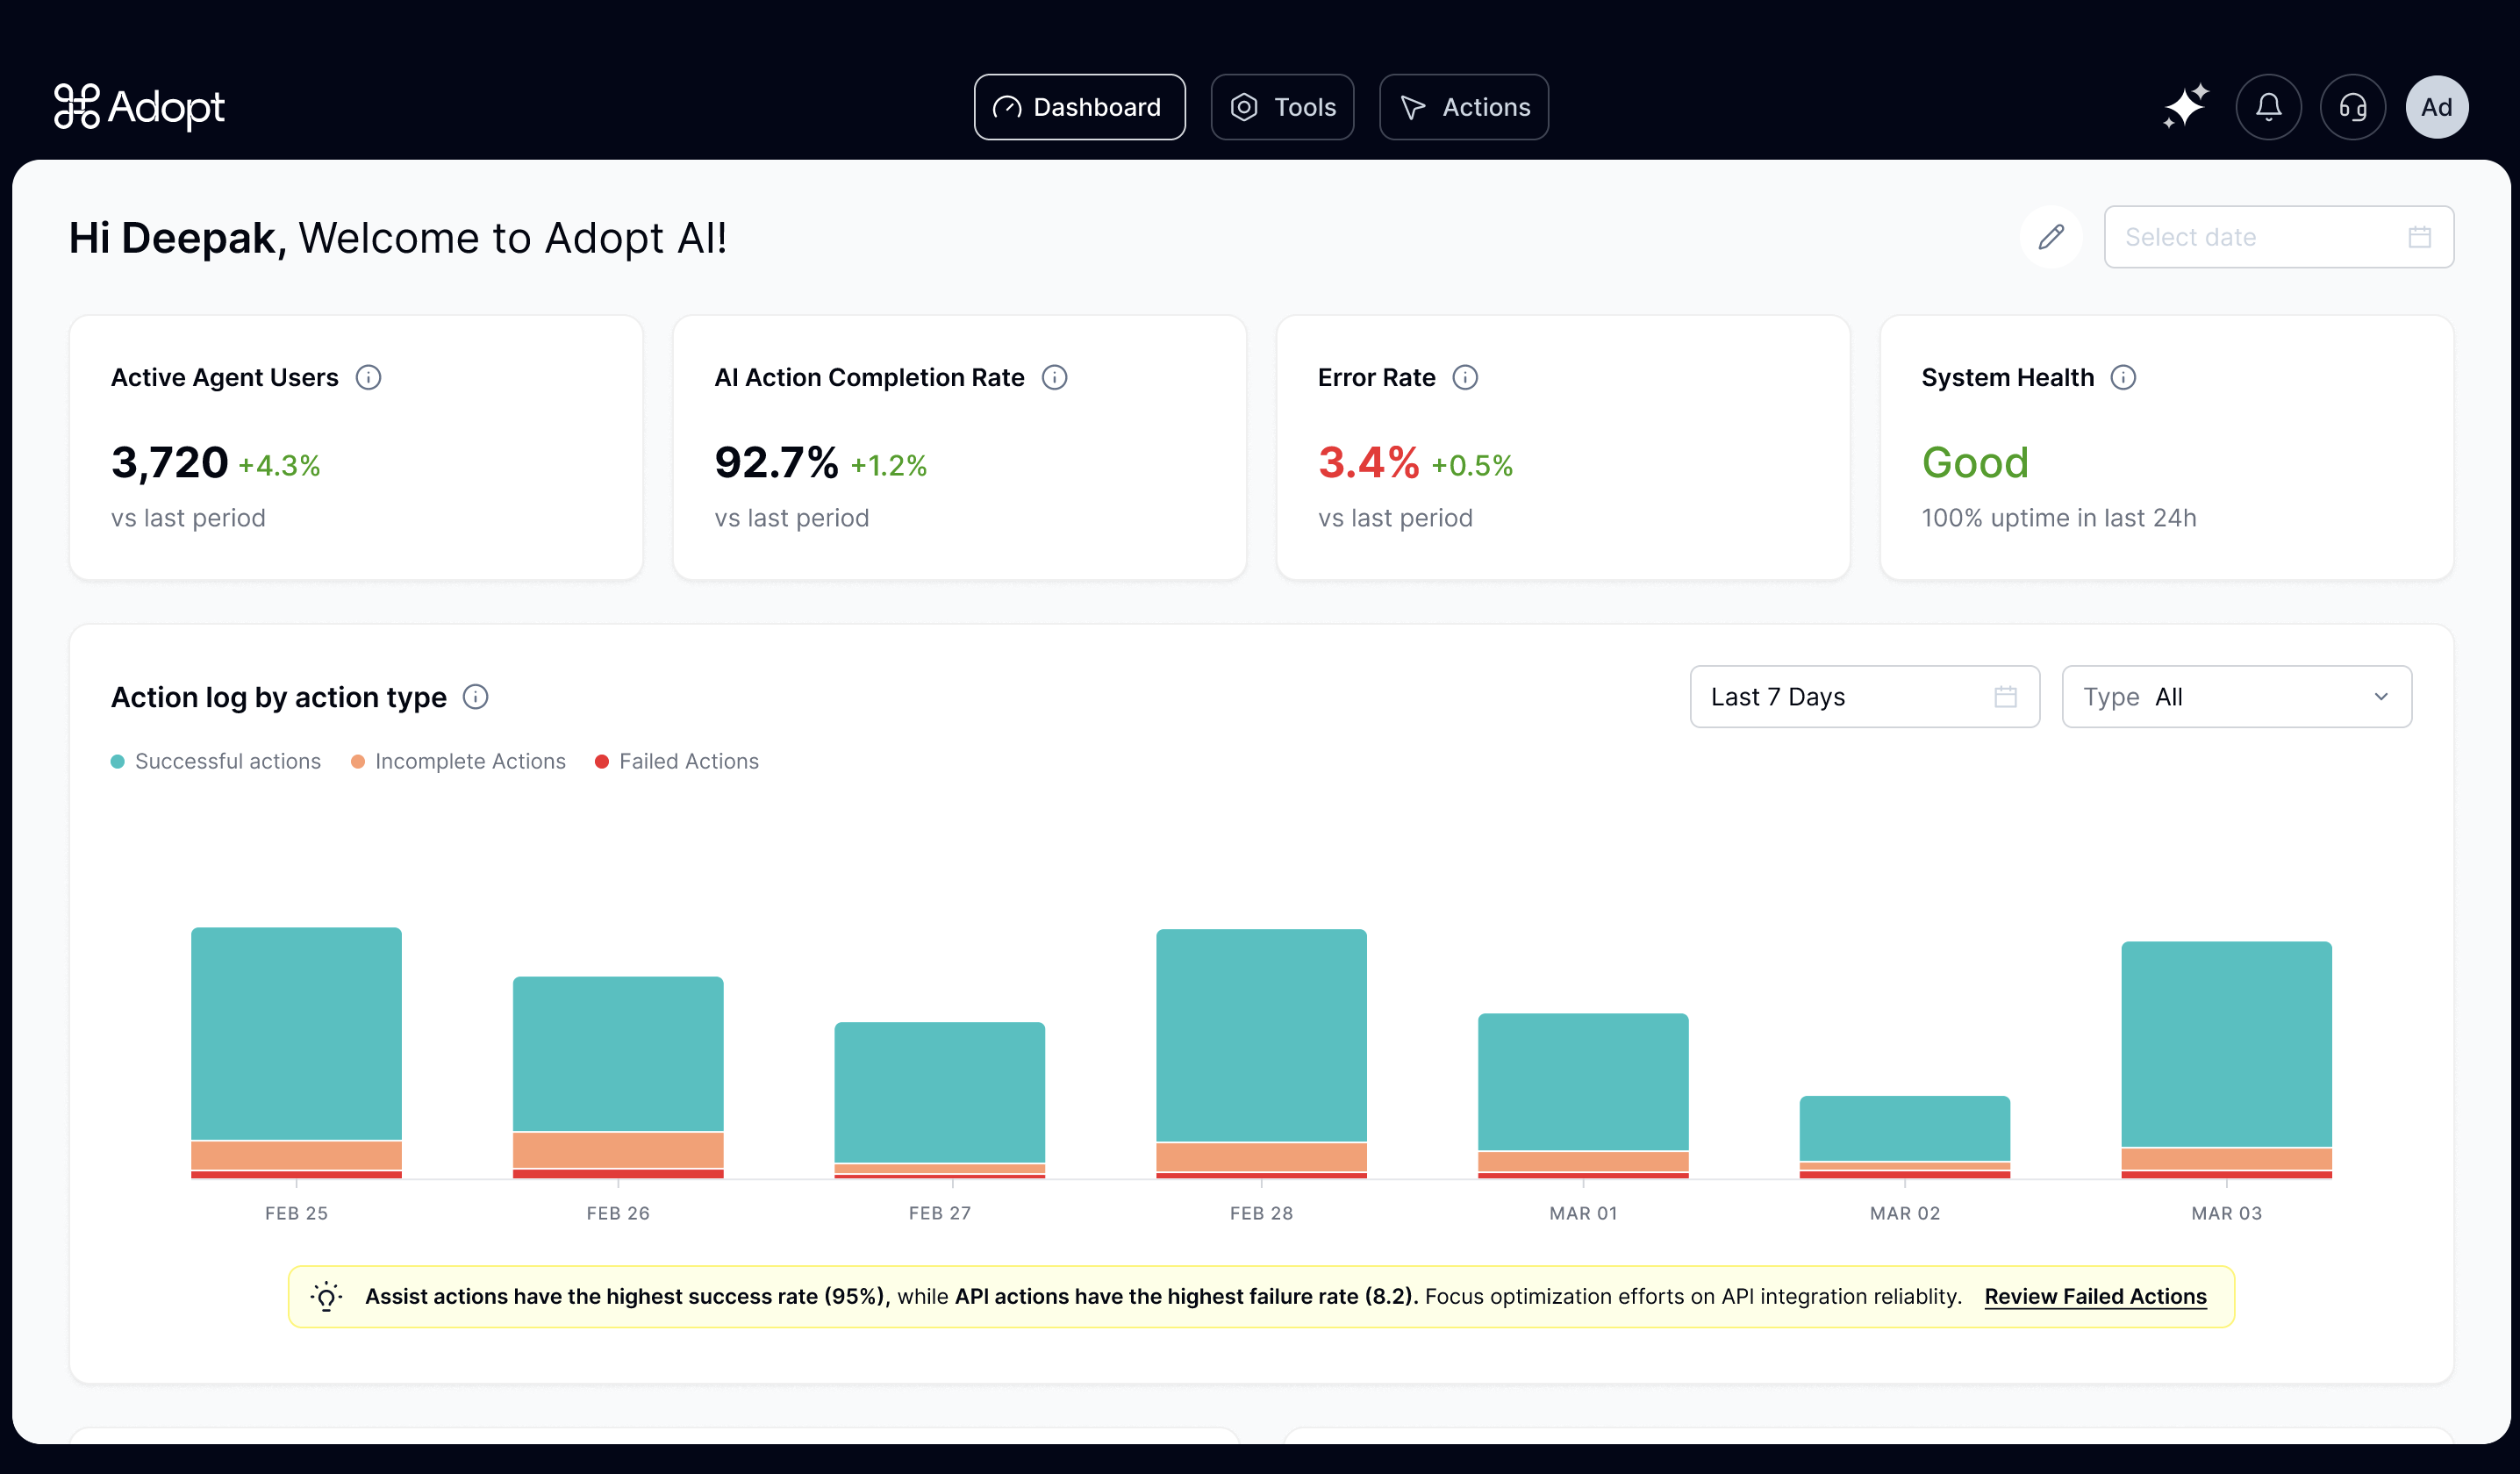
| Active Agent Users | Unique end users who interacted with the Agent at least once in the past 7 days. | Gauges weekly engagement and adoption of the Agent experience. |
| Agent Action Completion Rate | % of actions successfully completed out of all user-initiated actions. | Measures how reliably the agent is delivering results. |
| Error Rate | % of actions that failed, timed out, or didn’t complete successfully. | Identifies problem areas in execution logic or backend stability. |
| System Health | Uptime percentage of the Agent experience for end users. | Alerts you to integration or infrastructure issues affecting agent availability. |
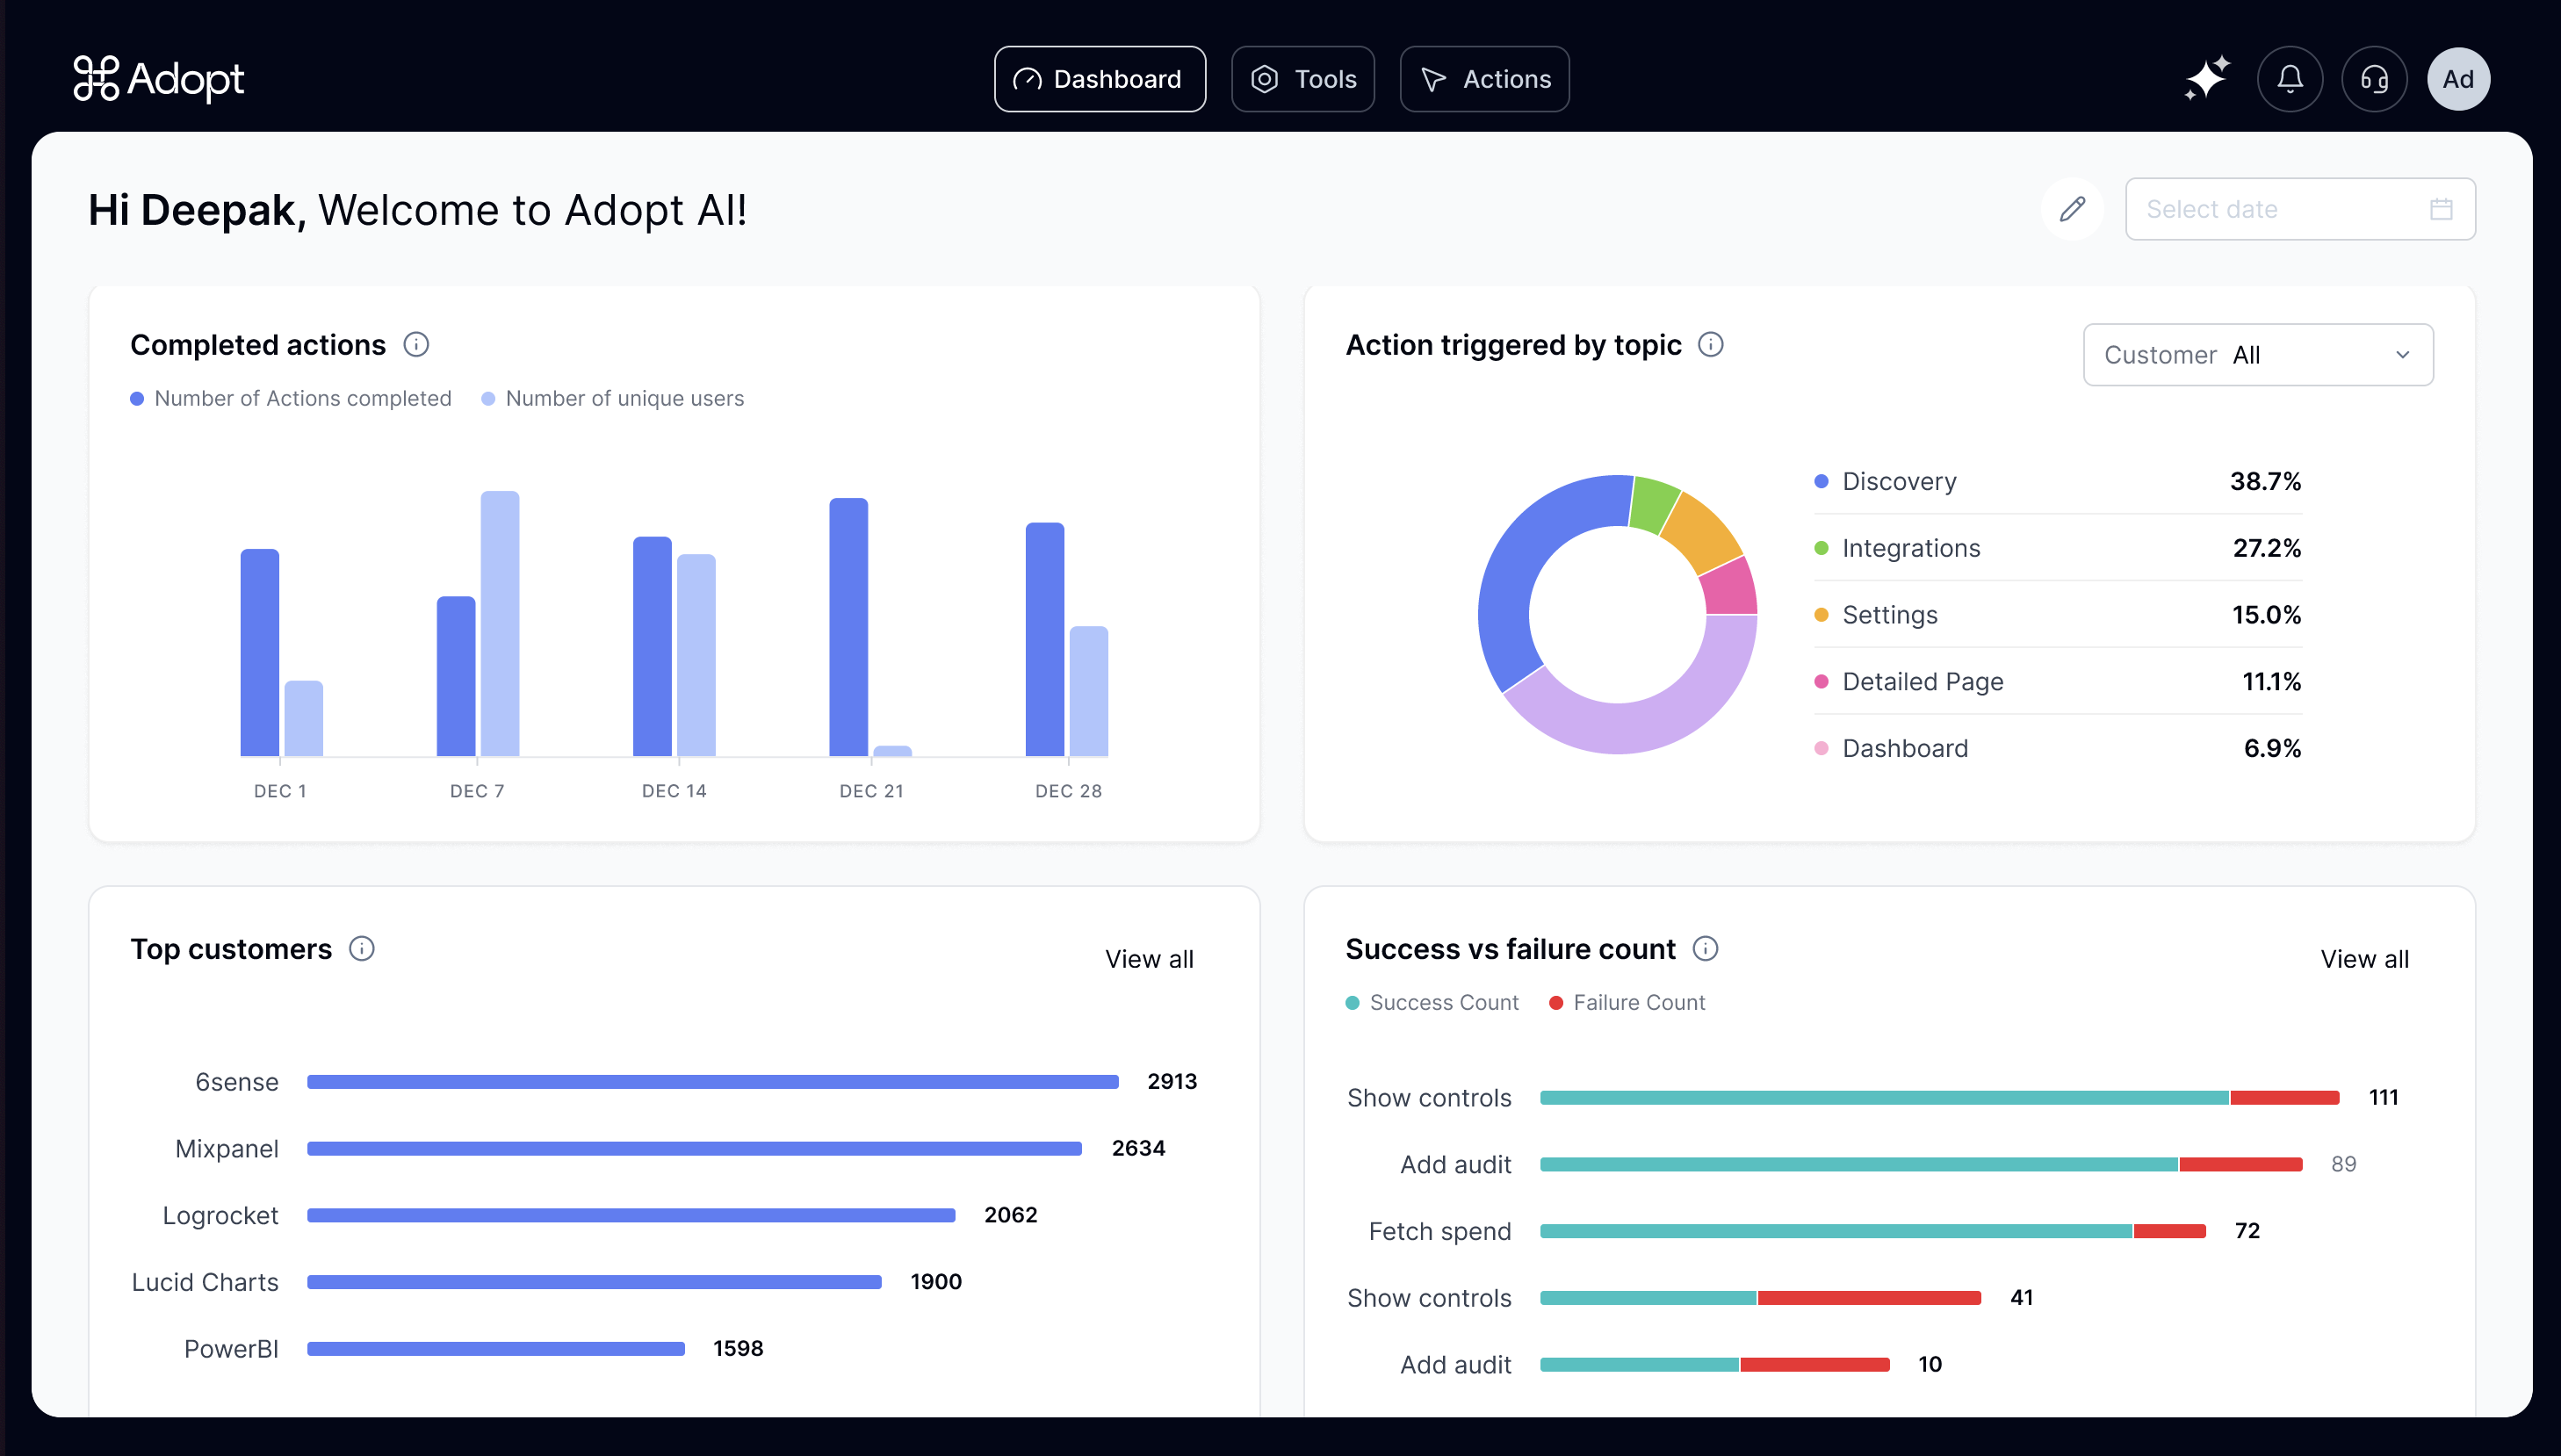
| Completed Actions | Daily count of completed actions alongside number of unique users. | Tracks usage trends and spikes in engagement over time. |
| Actions Triggered by Topic | Distribution of actions across product topics (e.g. Discovery, Settings, etc.). | Reveals which areas of your product users interact with most through the agent. |
| Top Customers | Accounts with the highest volume of agent interactions. | Identifies your most engaged and active customers. |
| Success vs Failure Count | Breakdown of individual actions by number of successes and failures. | Pinpoints which actions are working smoothly and which need debugging or refinement. |
| Action Type Distribution & Impact | % of agent usage by action type: Assist, Navigation, API (CRUD). | Helps you understand how users are using the agent—guidance, navigation, or performing real tasks. |
| Customer Time on Adopt vs App | Comparison of user time spent with the agent vs within your application UI. | Measures how much the agent is streamlining workflows and reducing manual effort. |
| Thumbs Up | Total number of positive feedback signals on agent responses or actions. | Shows which actions are performing well and creating positive user experiences. |
| Thumbs Down | Total number of negative feedback signals, and which actions received them. | Flags pain points or confusing experiences in the agent flow. |