Overview
This page covers every feature available in the Pipeline module. Use it as a reference when building, monitoring, or troubleshooting your pipelines.Pipeline Statuses
A pipeline can be in one of three states: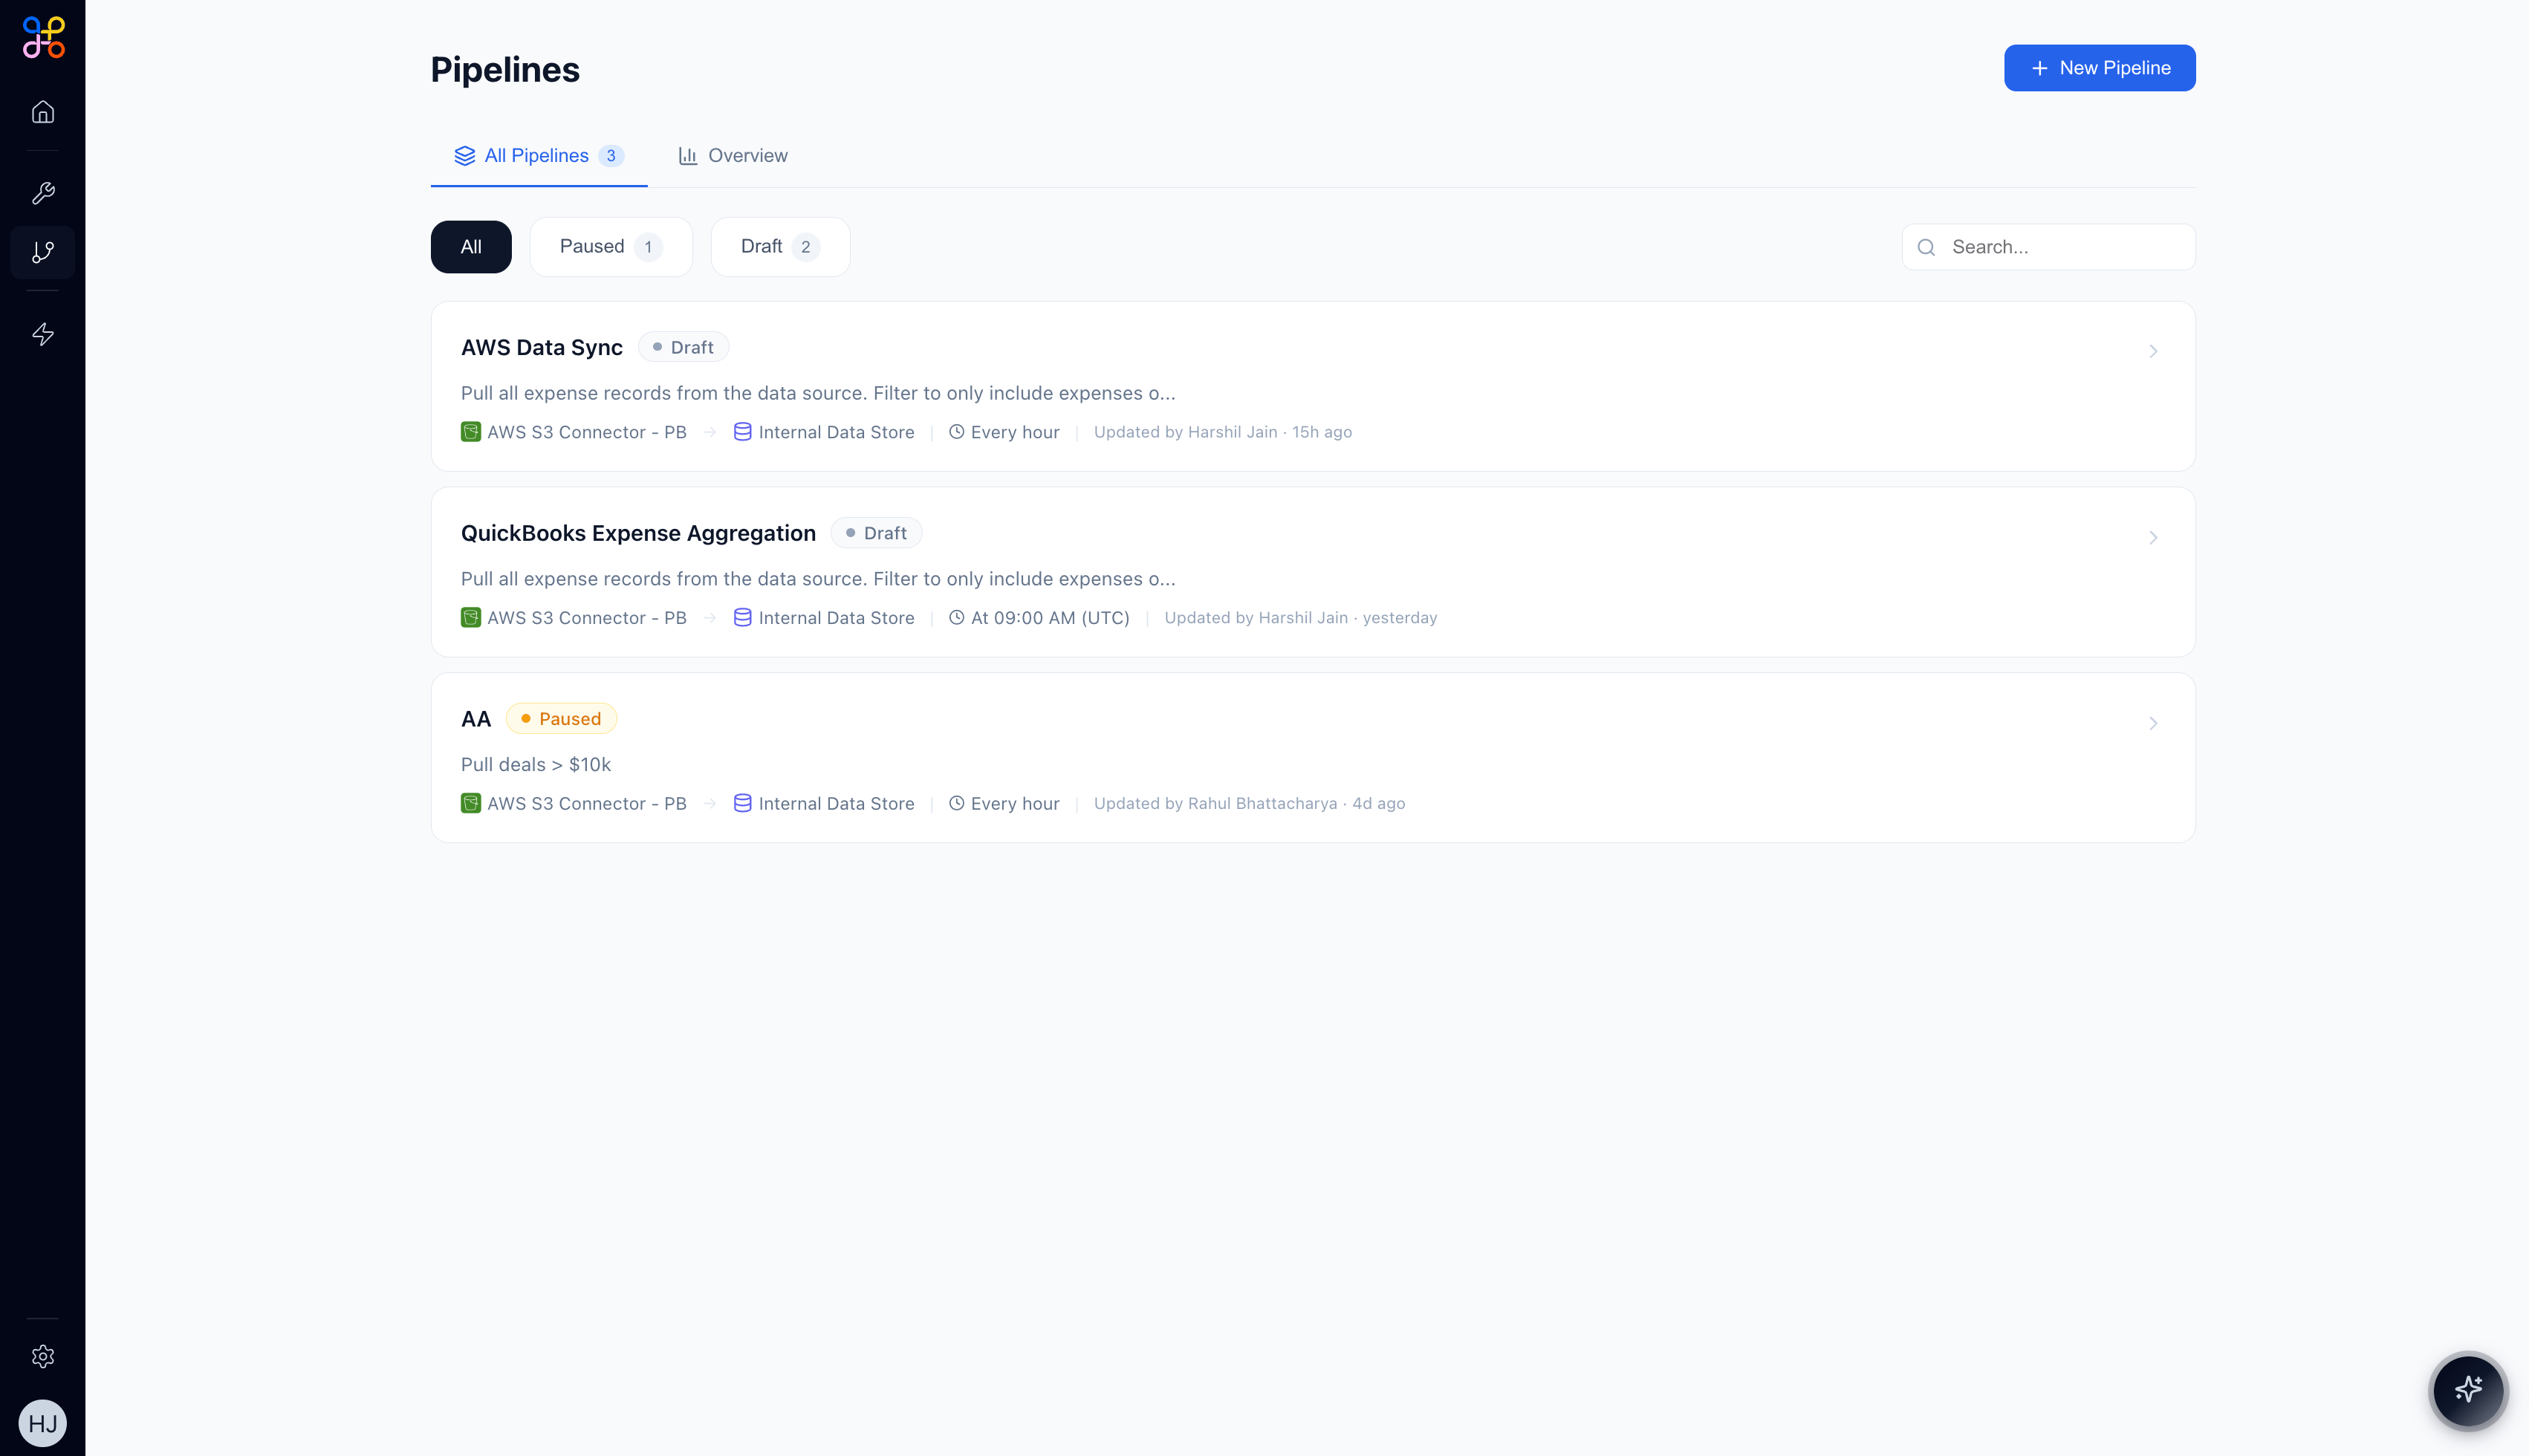
The Overview Tab
When you open a pipeline, the Overview tab gives you a health summary at a glance.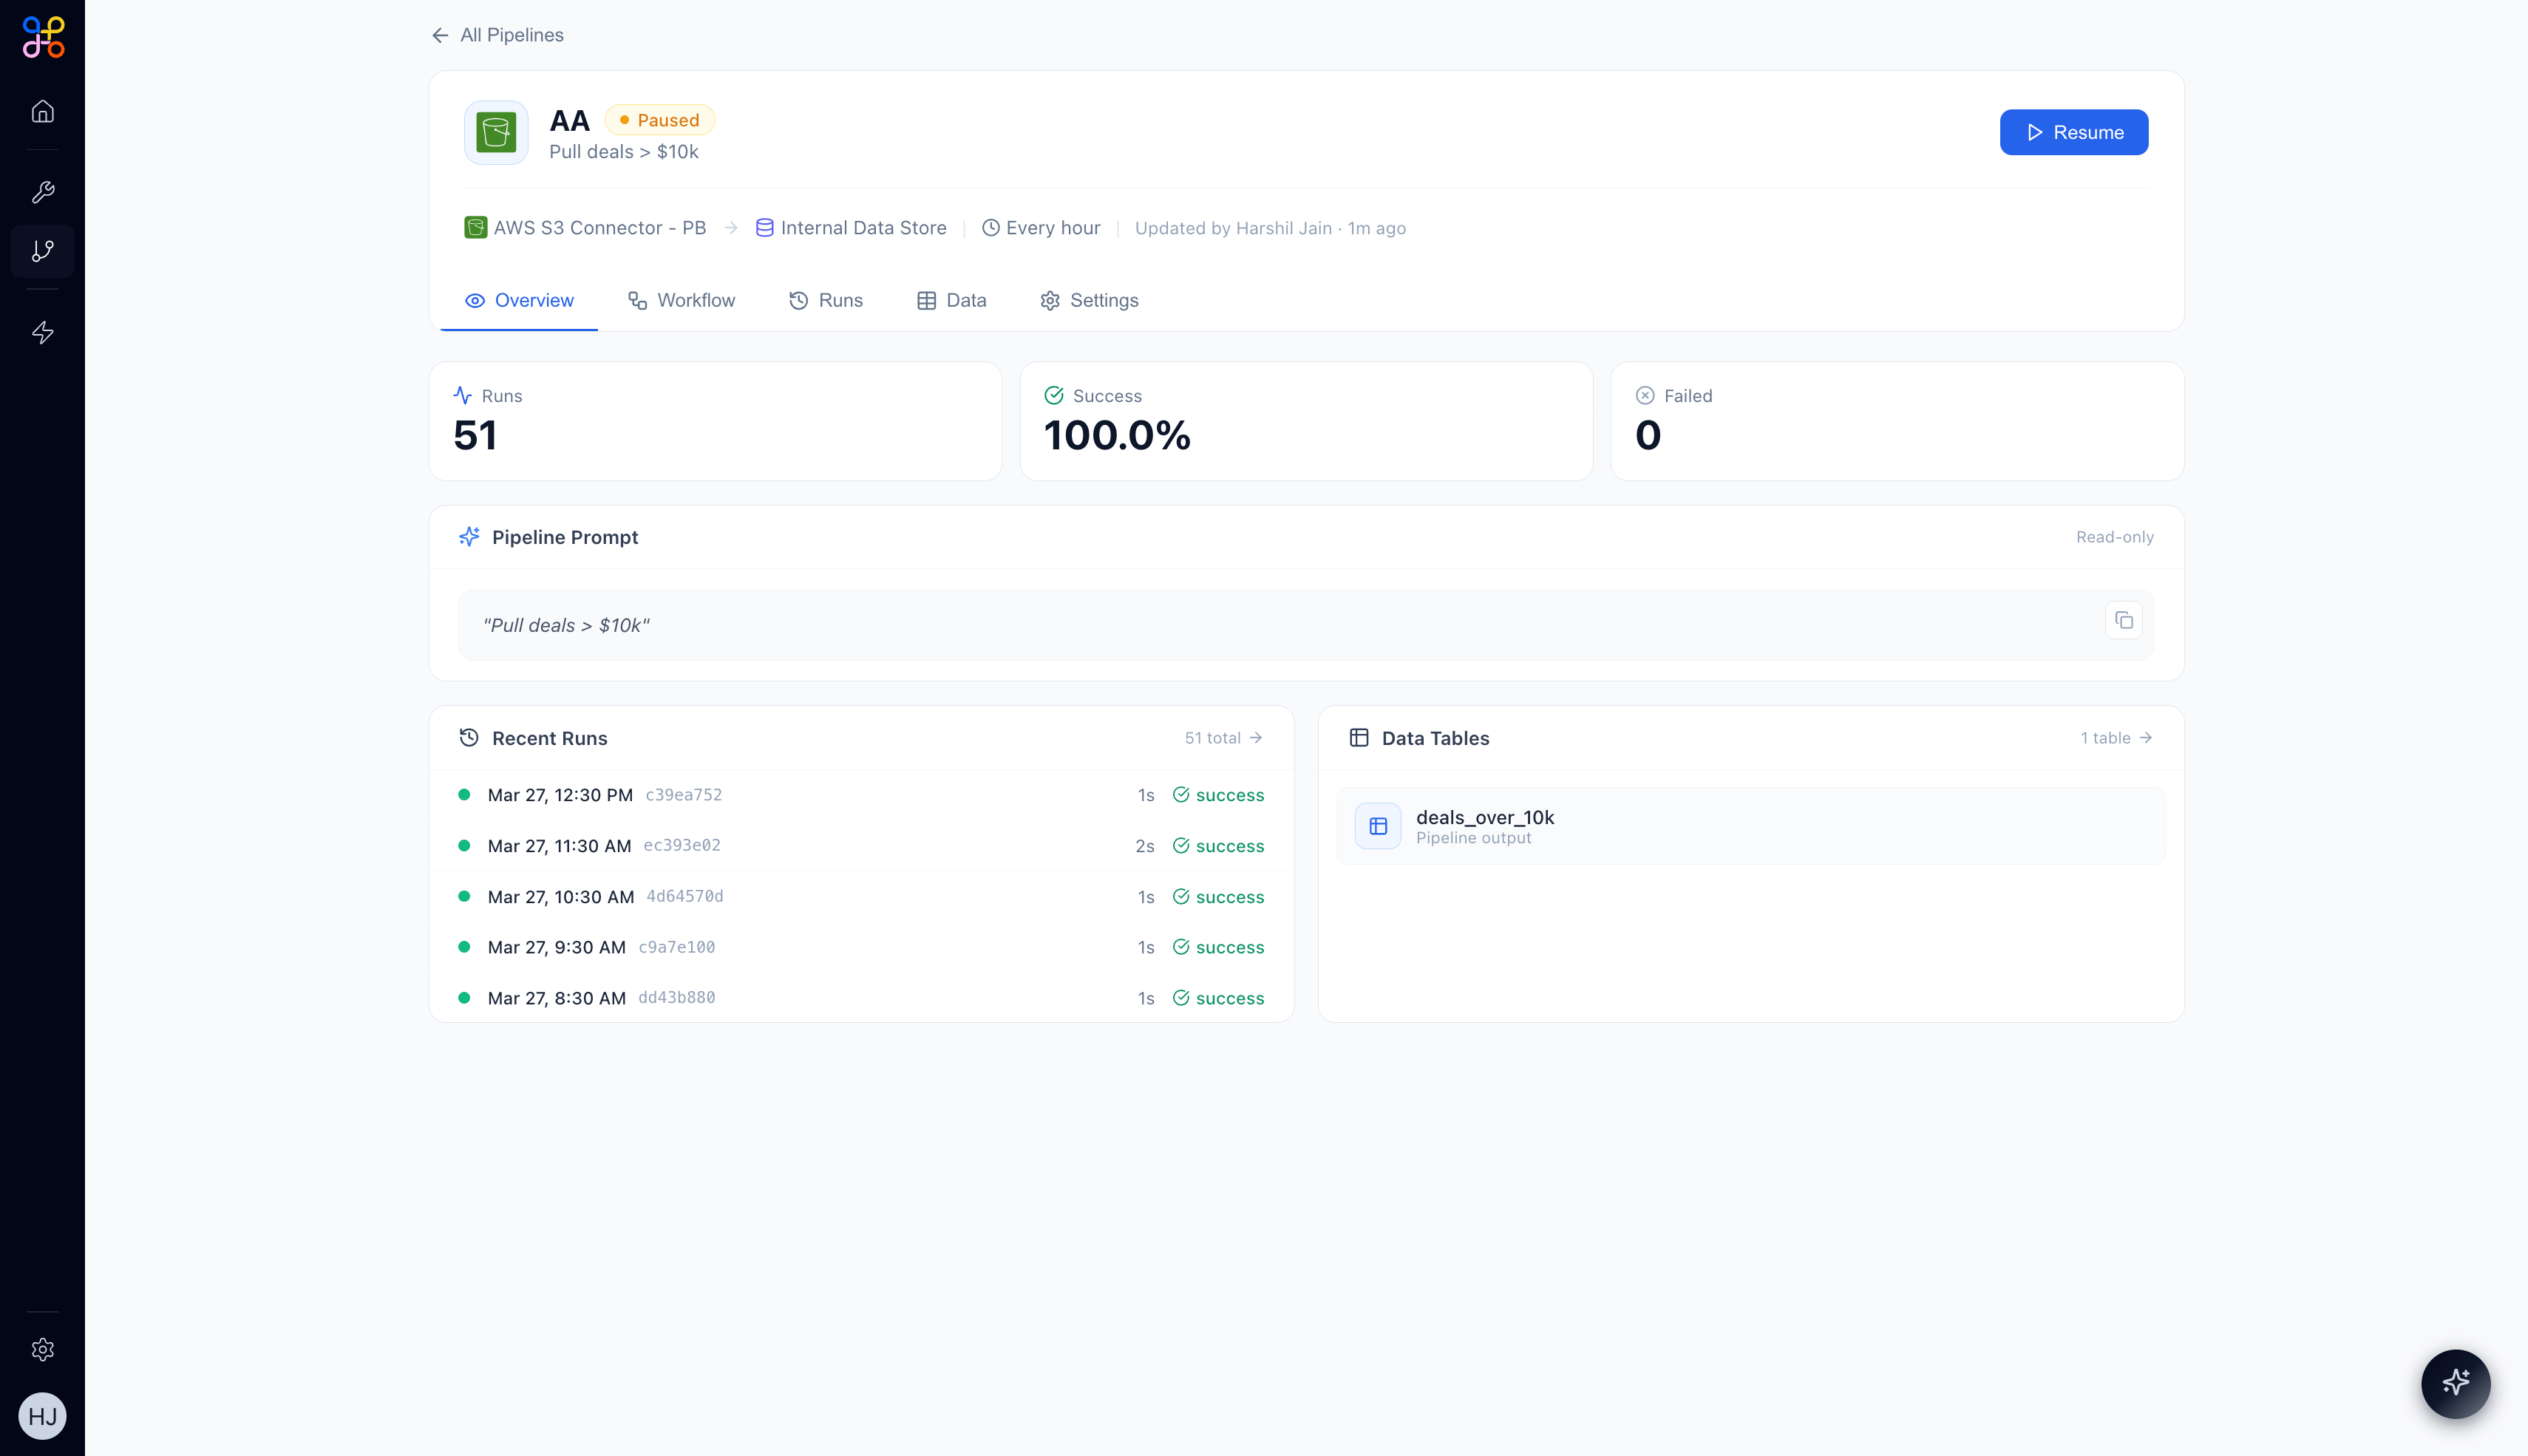
- Runs — total number of executions
- Success — percentage of successful runs (e.g., 100.0%)
- Failed — number of failed runs
- Pipeline Prompt — the natural language description used to generate the workflow (read-only)
- Recent Runs — the last 5 runs with timestamps and status
- Data Tables — the named Pipeline Outcomes produced by this pipeline
The Workflow Tab
The Workflow tab shows the pipeline’s logic as a visual directed graph.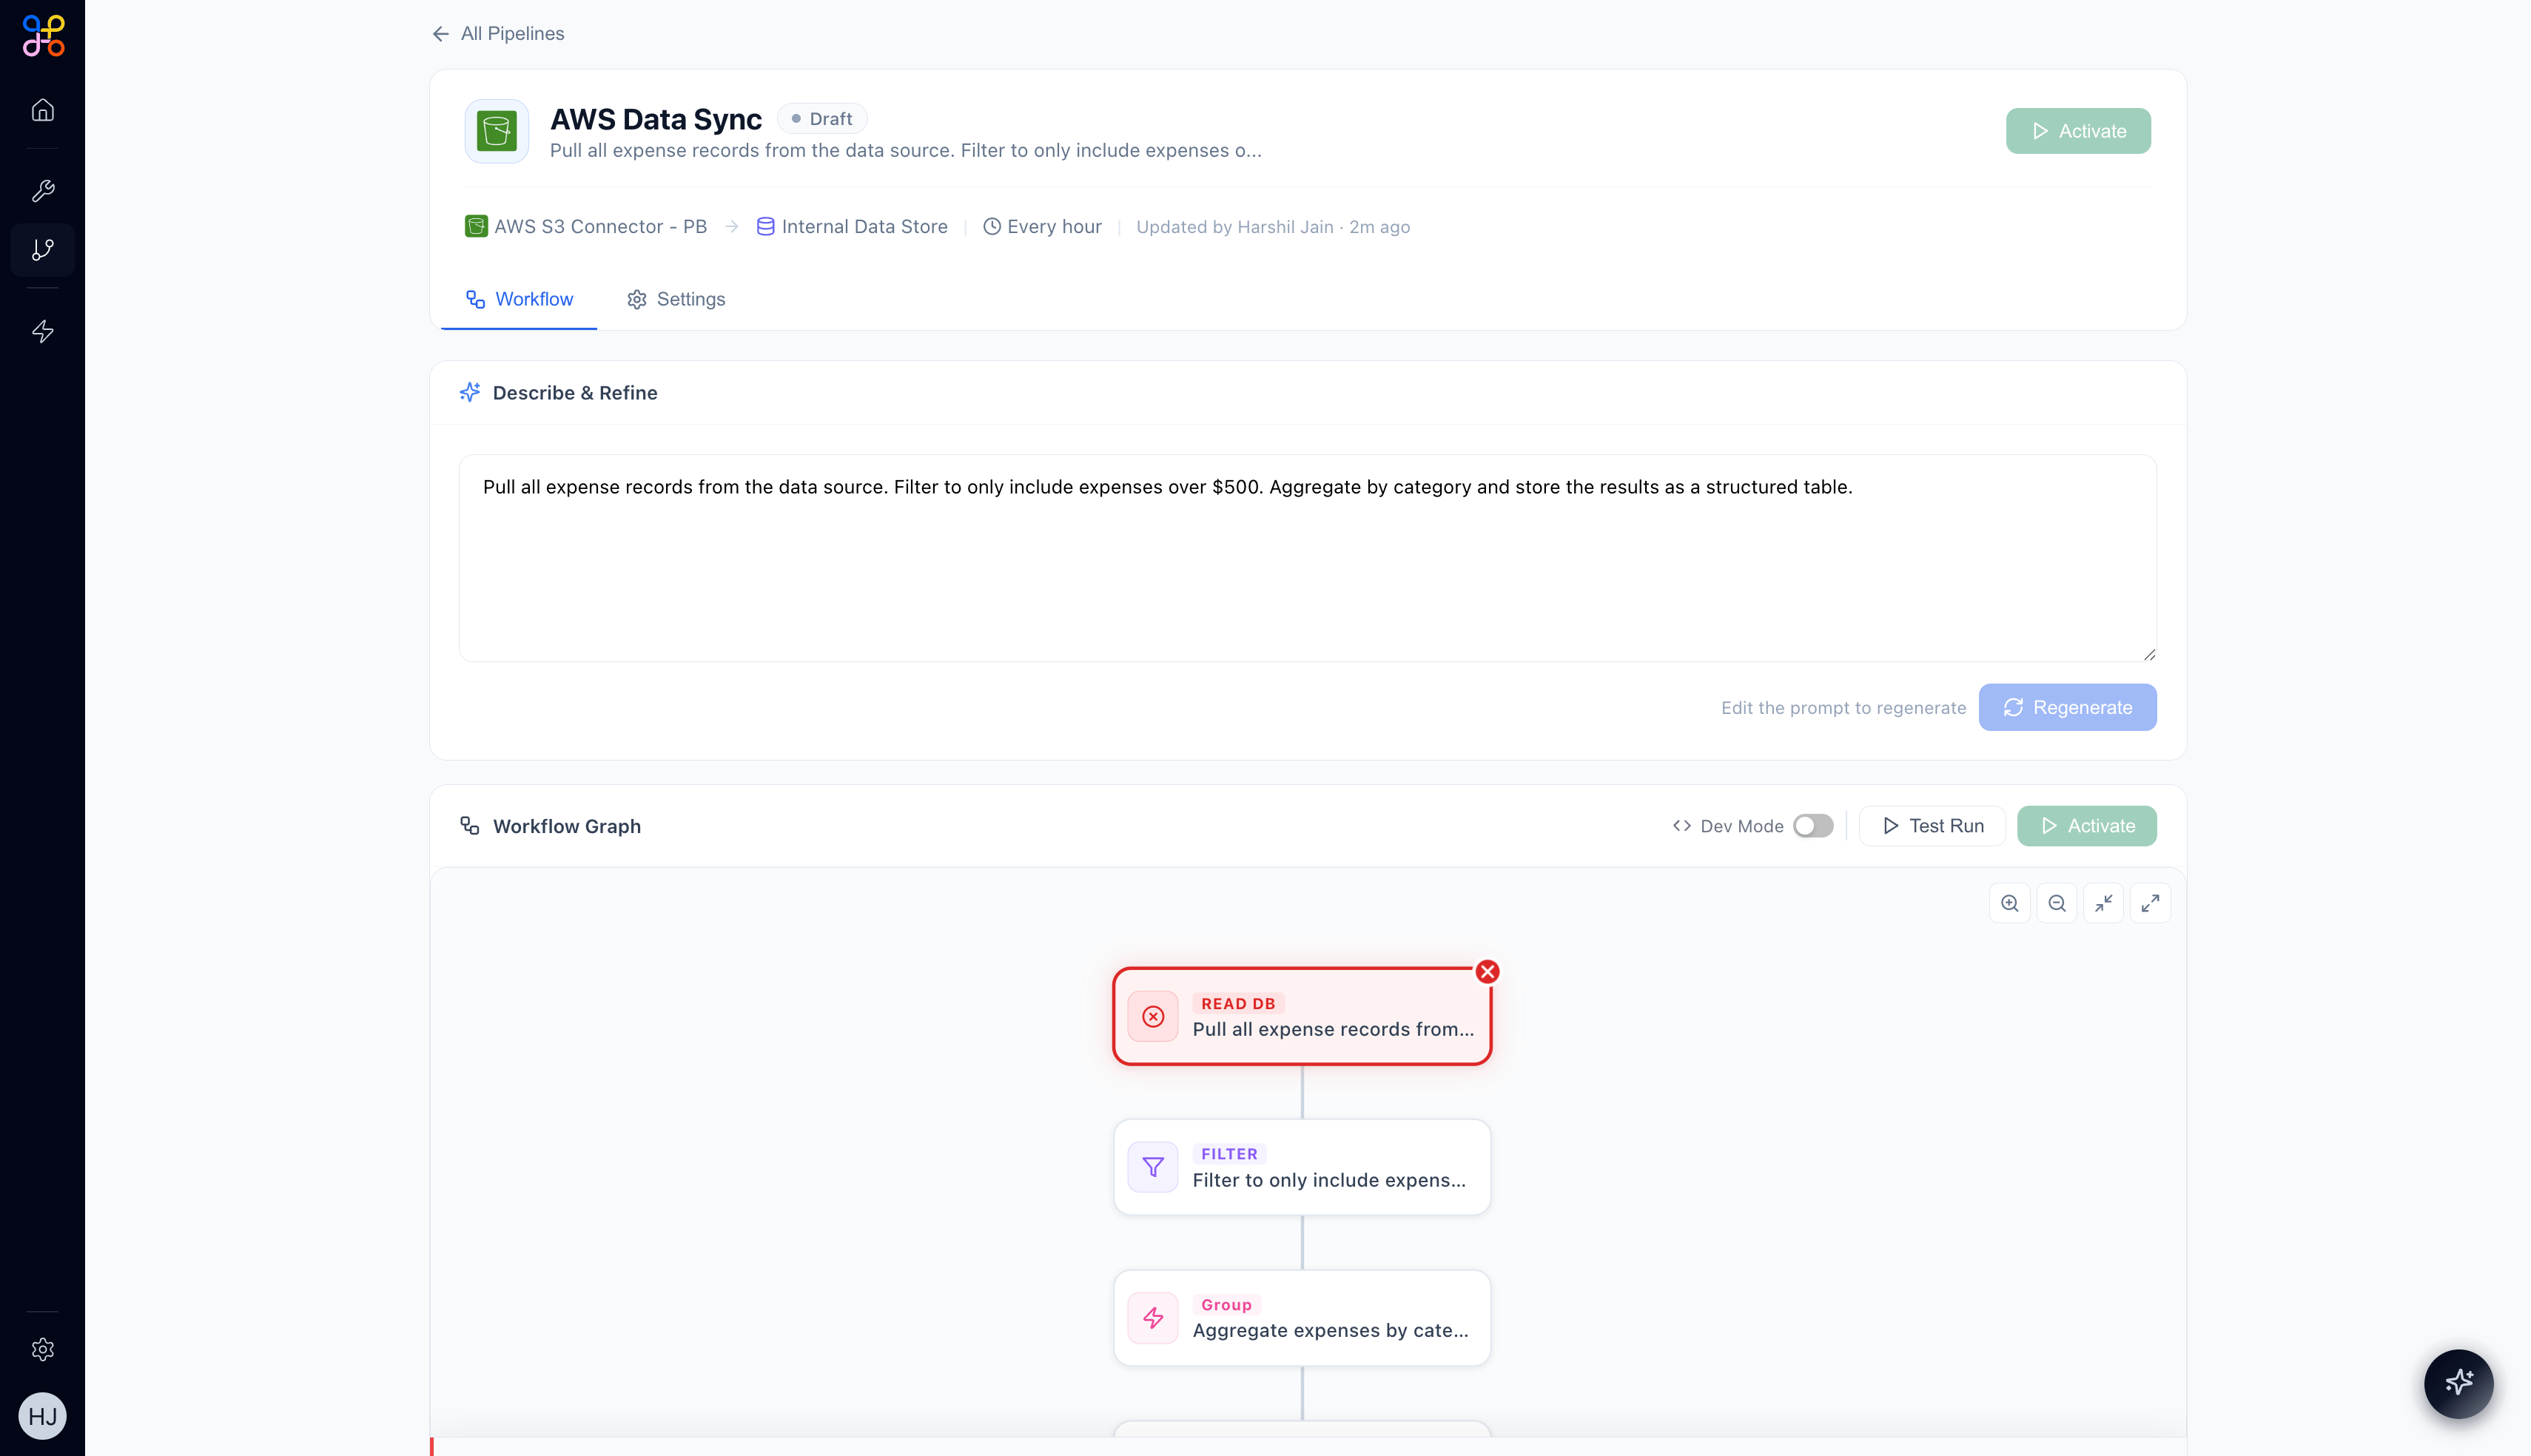
Pipeline Prompt
The top section shows the natural language description used to generate (and optionally regenerate) the workflow. In Draft state this is editable; in Active/Paused state it is read-only.Workflow Graph
The graph displays every step of the pipeline as a connected sequence of nodes. Nodes are color-coded by type:
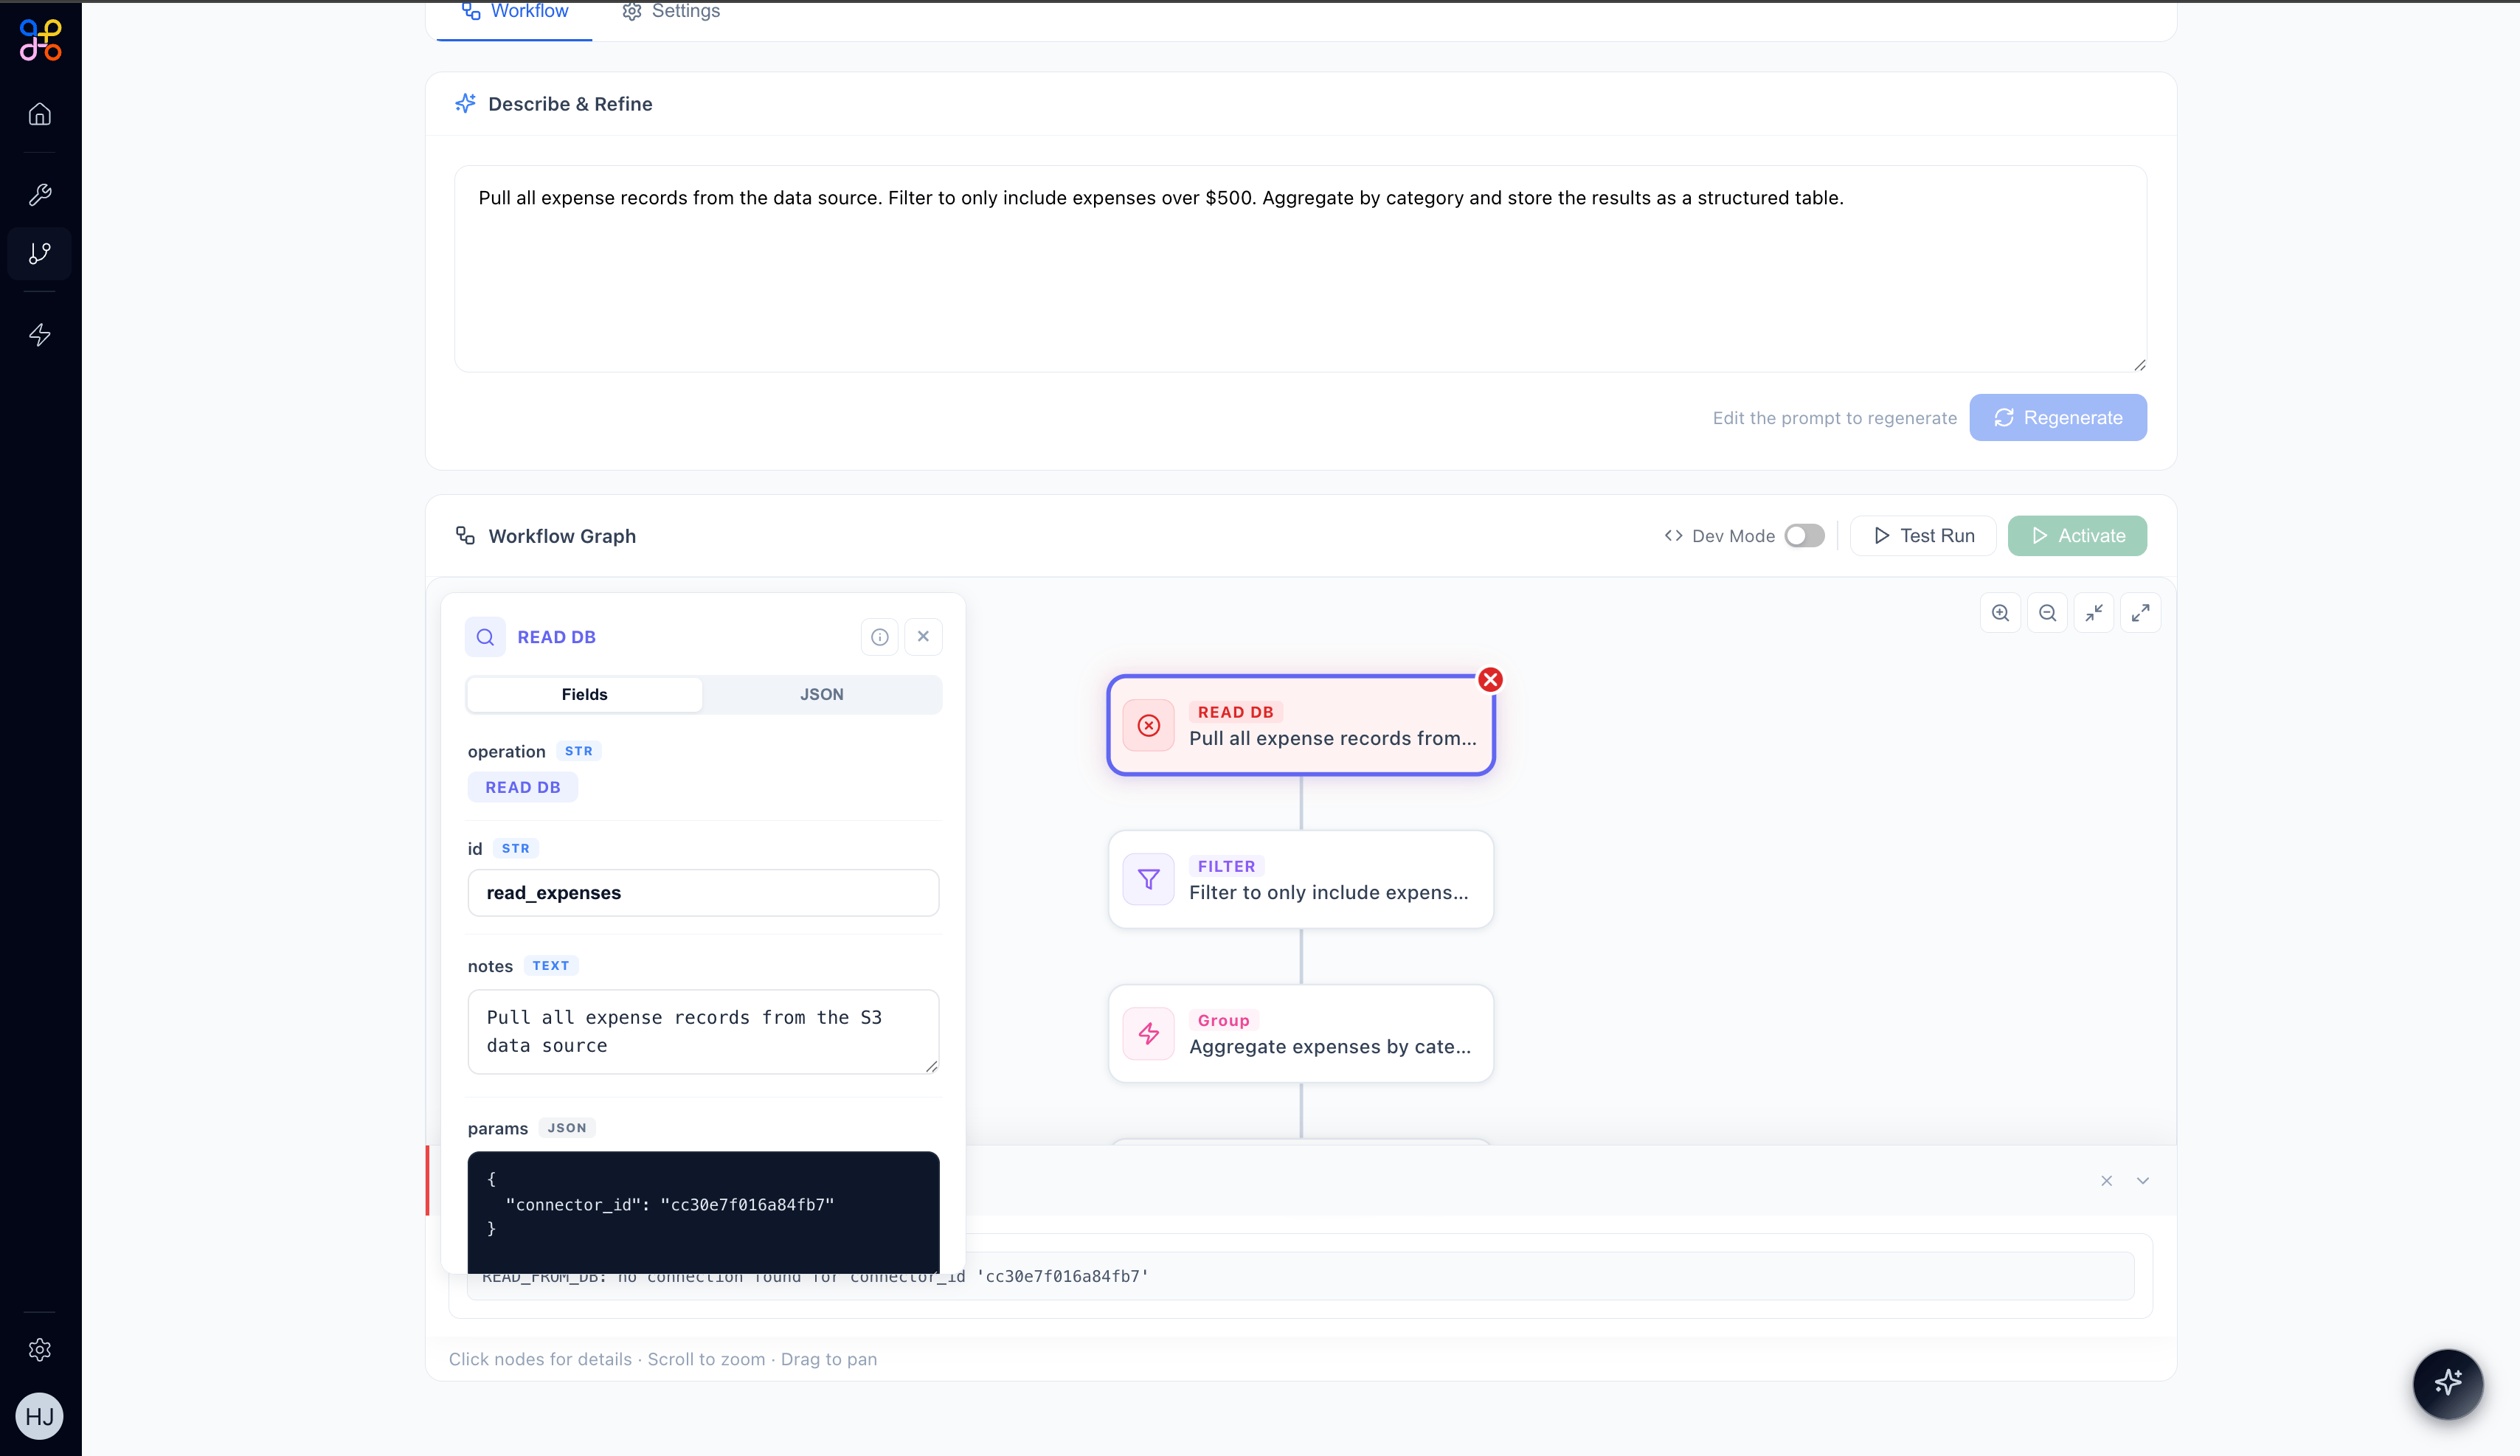
Clicking a node opens a detail panel showing its configuration in Fields view or raw JSON view.
Controls
- Dev Mode toggle — switch to a raw view of the workflow definition (for advanced inspection)
- Test Run — execute the pipeline immediately against real data (in Draft or Active state)
- Activate / Pause / Resume — change the pipeline’s running state
The Runs Tab
The Runs tab provides a full history of all pipeline executions.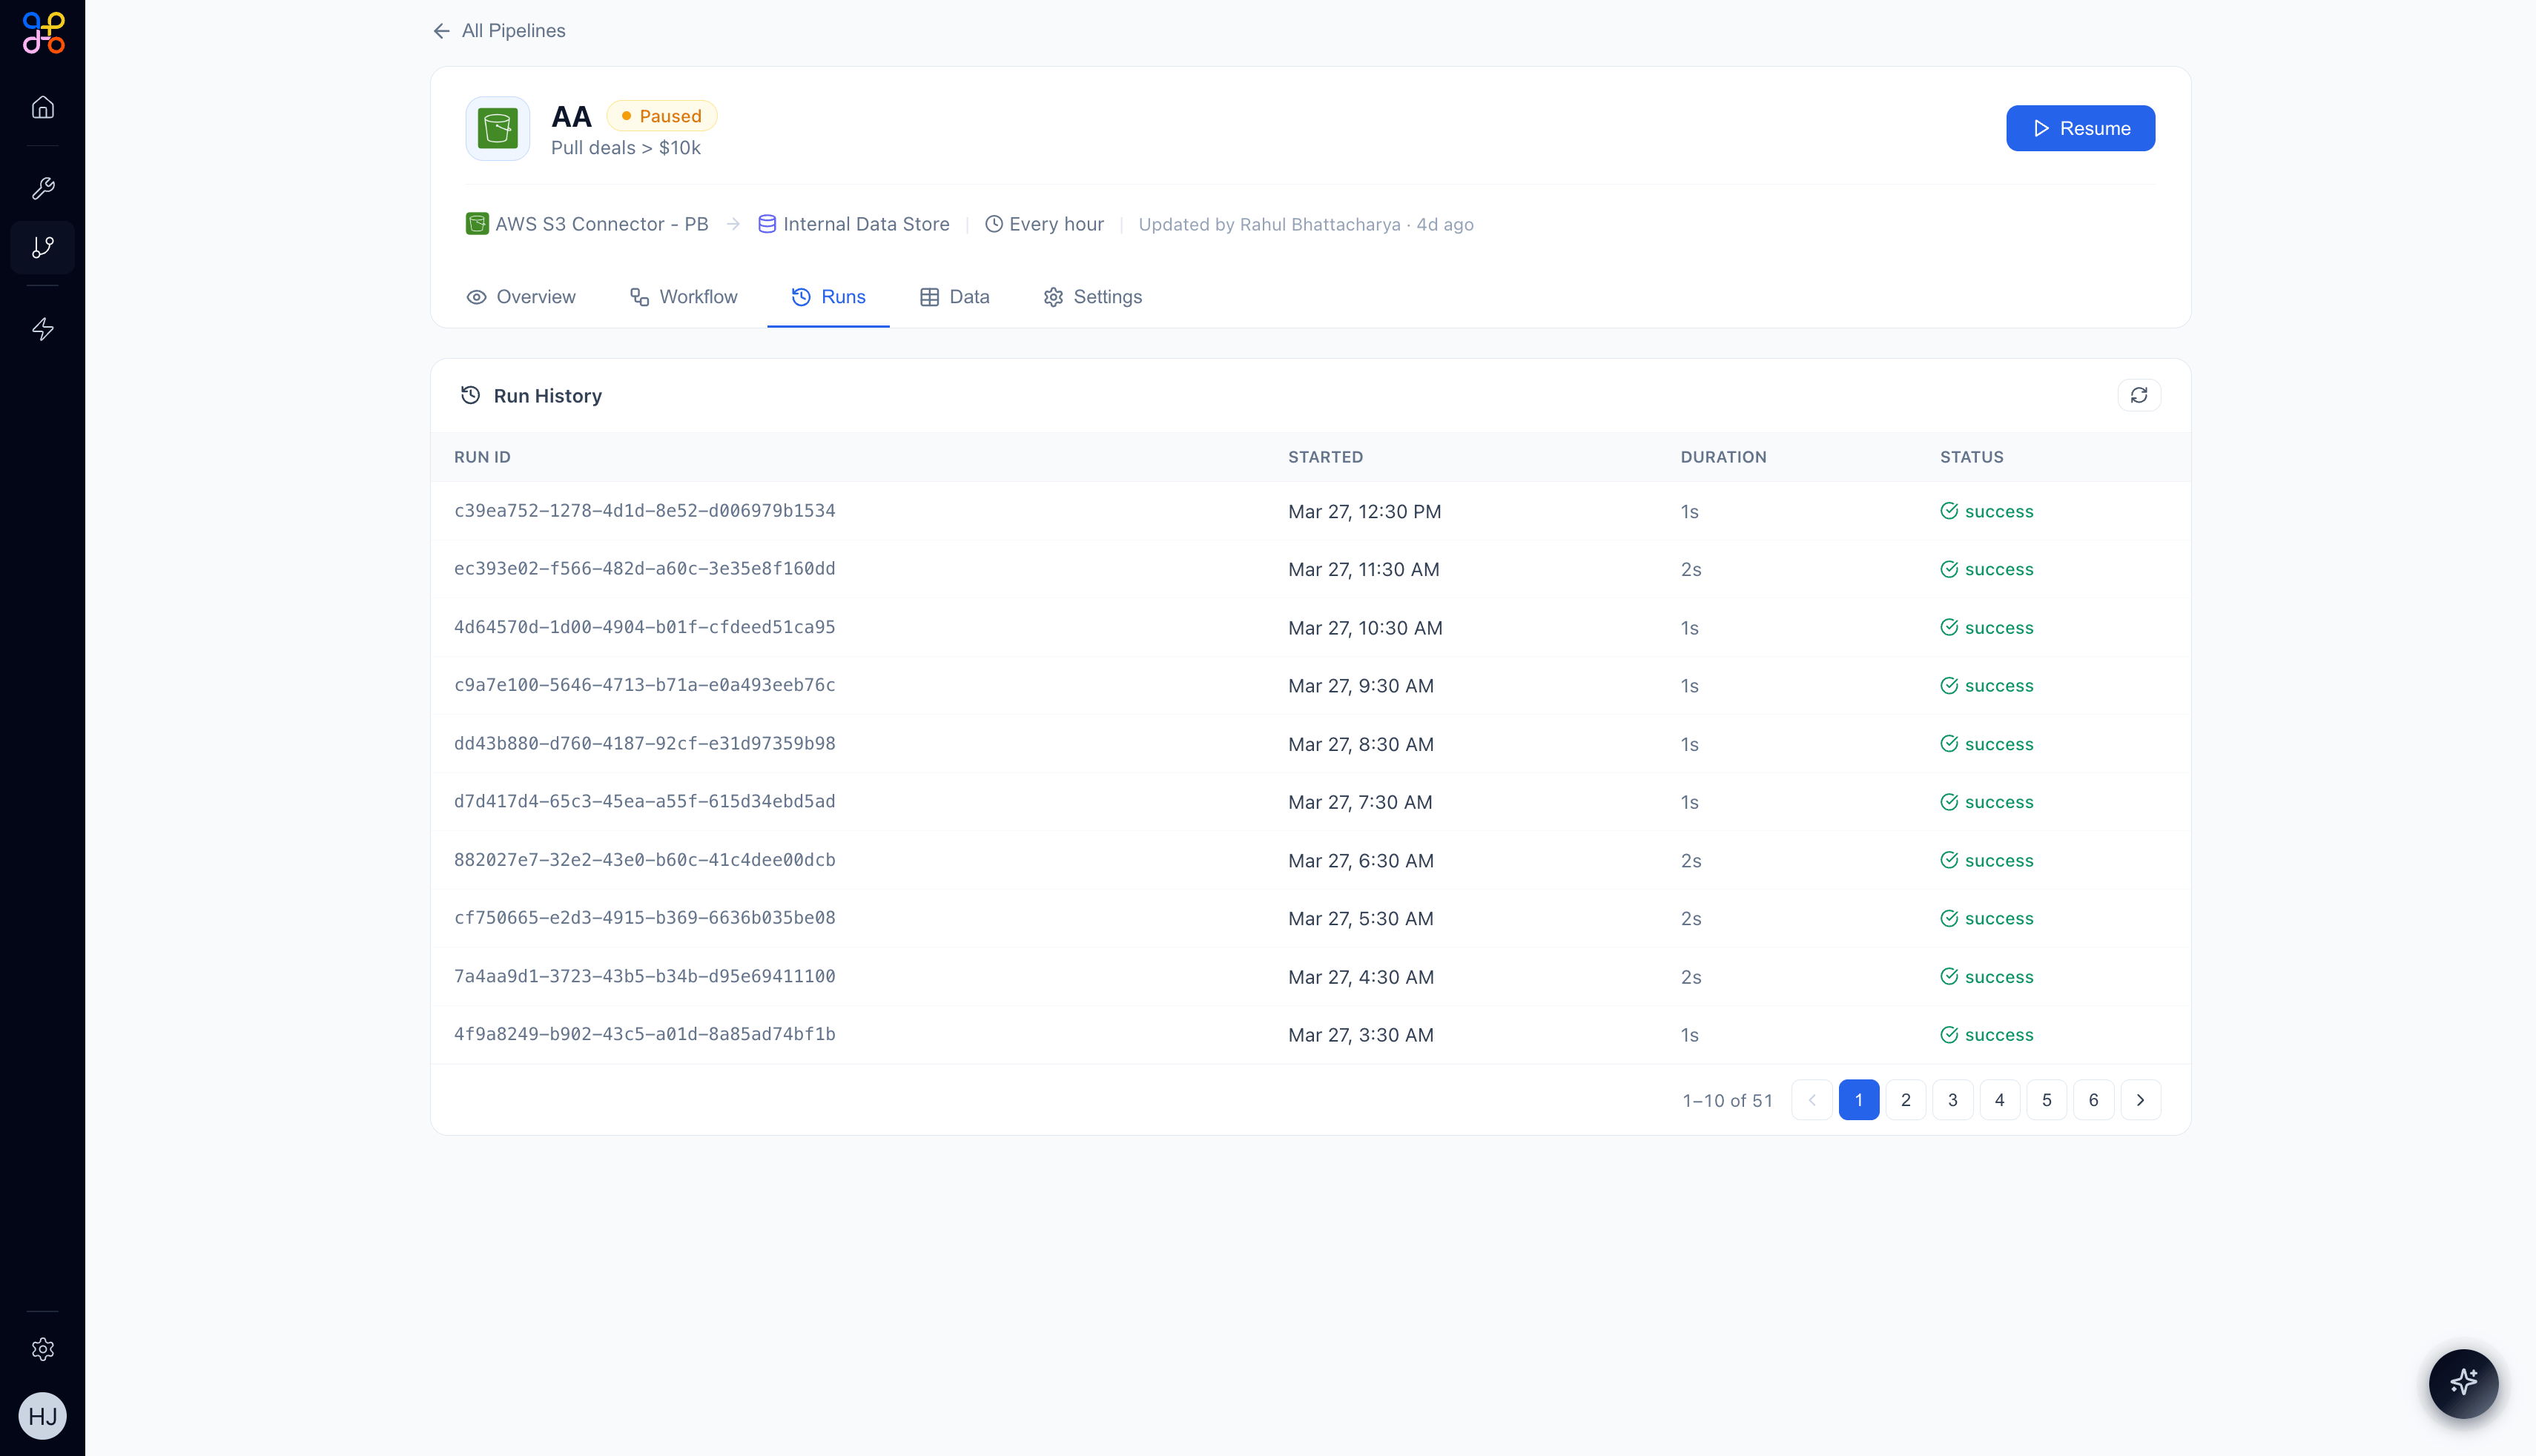
- Run ID — unique identifier for the execution
- Started — date and time the run began
- Duration — how long the run took (typically 1–3 seconds for well-formed pipelines)
- Status —
successorfailed
The pipeline overview stat card shows total runs, success rate, and failure count. If your success rate drops below 100%, investigate recent runs for errors and check that your connector credentials are still valid.
The Data Tab
The Data tab shows the current Pipeline Outcomes — the structured output tables produced by the most recent successful run. Each outcome table is labeled with its name (e.g.,
 deals_over_10k, aggregated_expenses) and shows records as rows. If the pipeline has never run or is paused, the message “No records yet — Records will appear here after the pipeline processes data” is shown.
The Settings Tab
The Settings tab gives you full control over the pipeline configuration.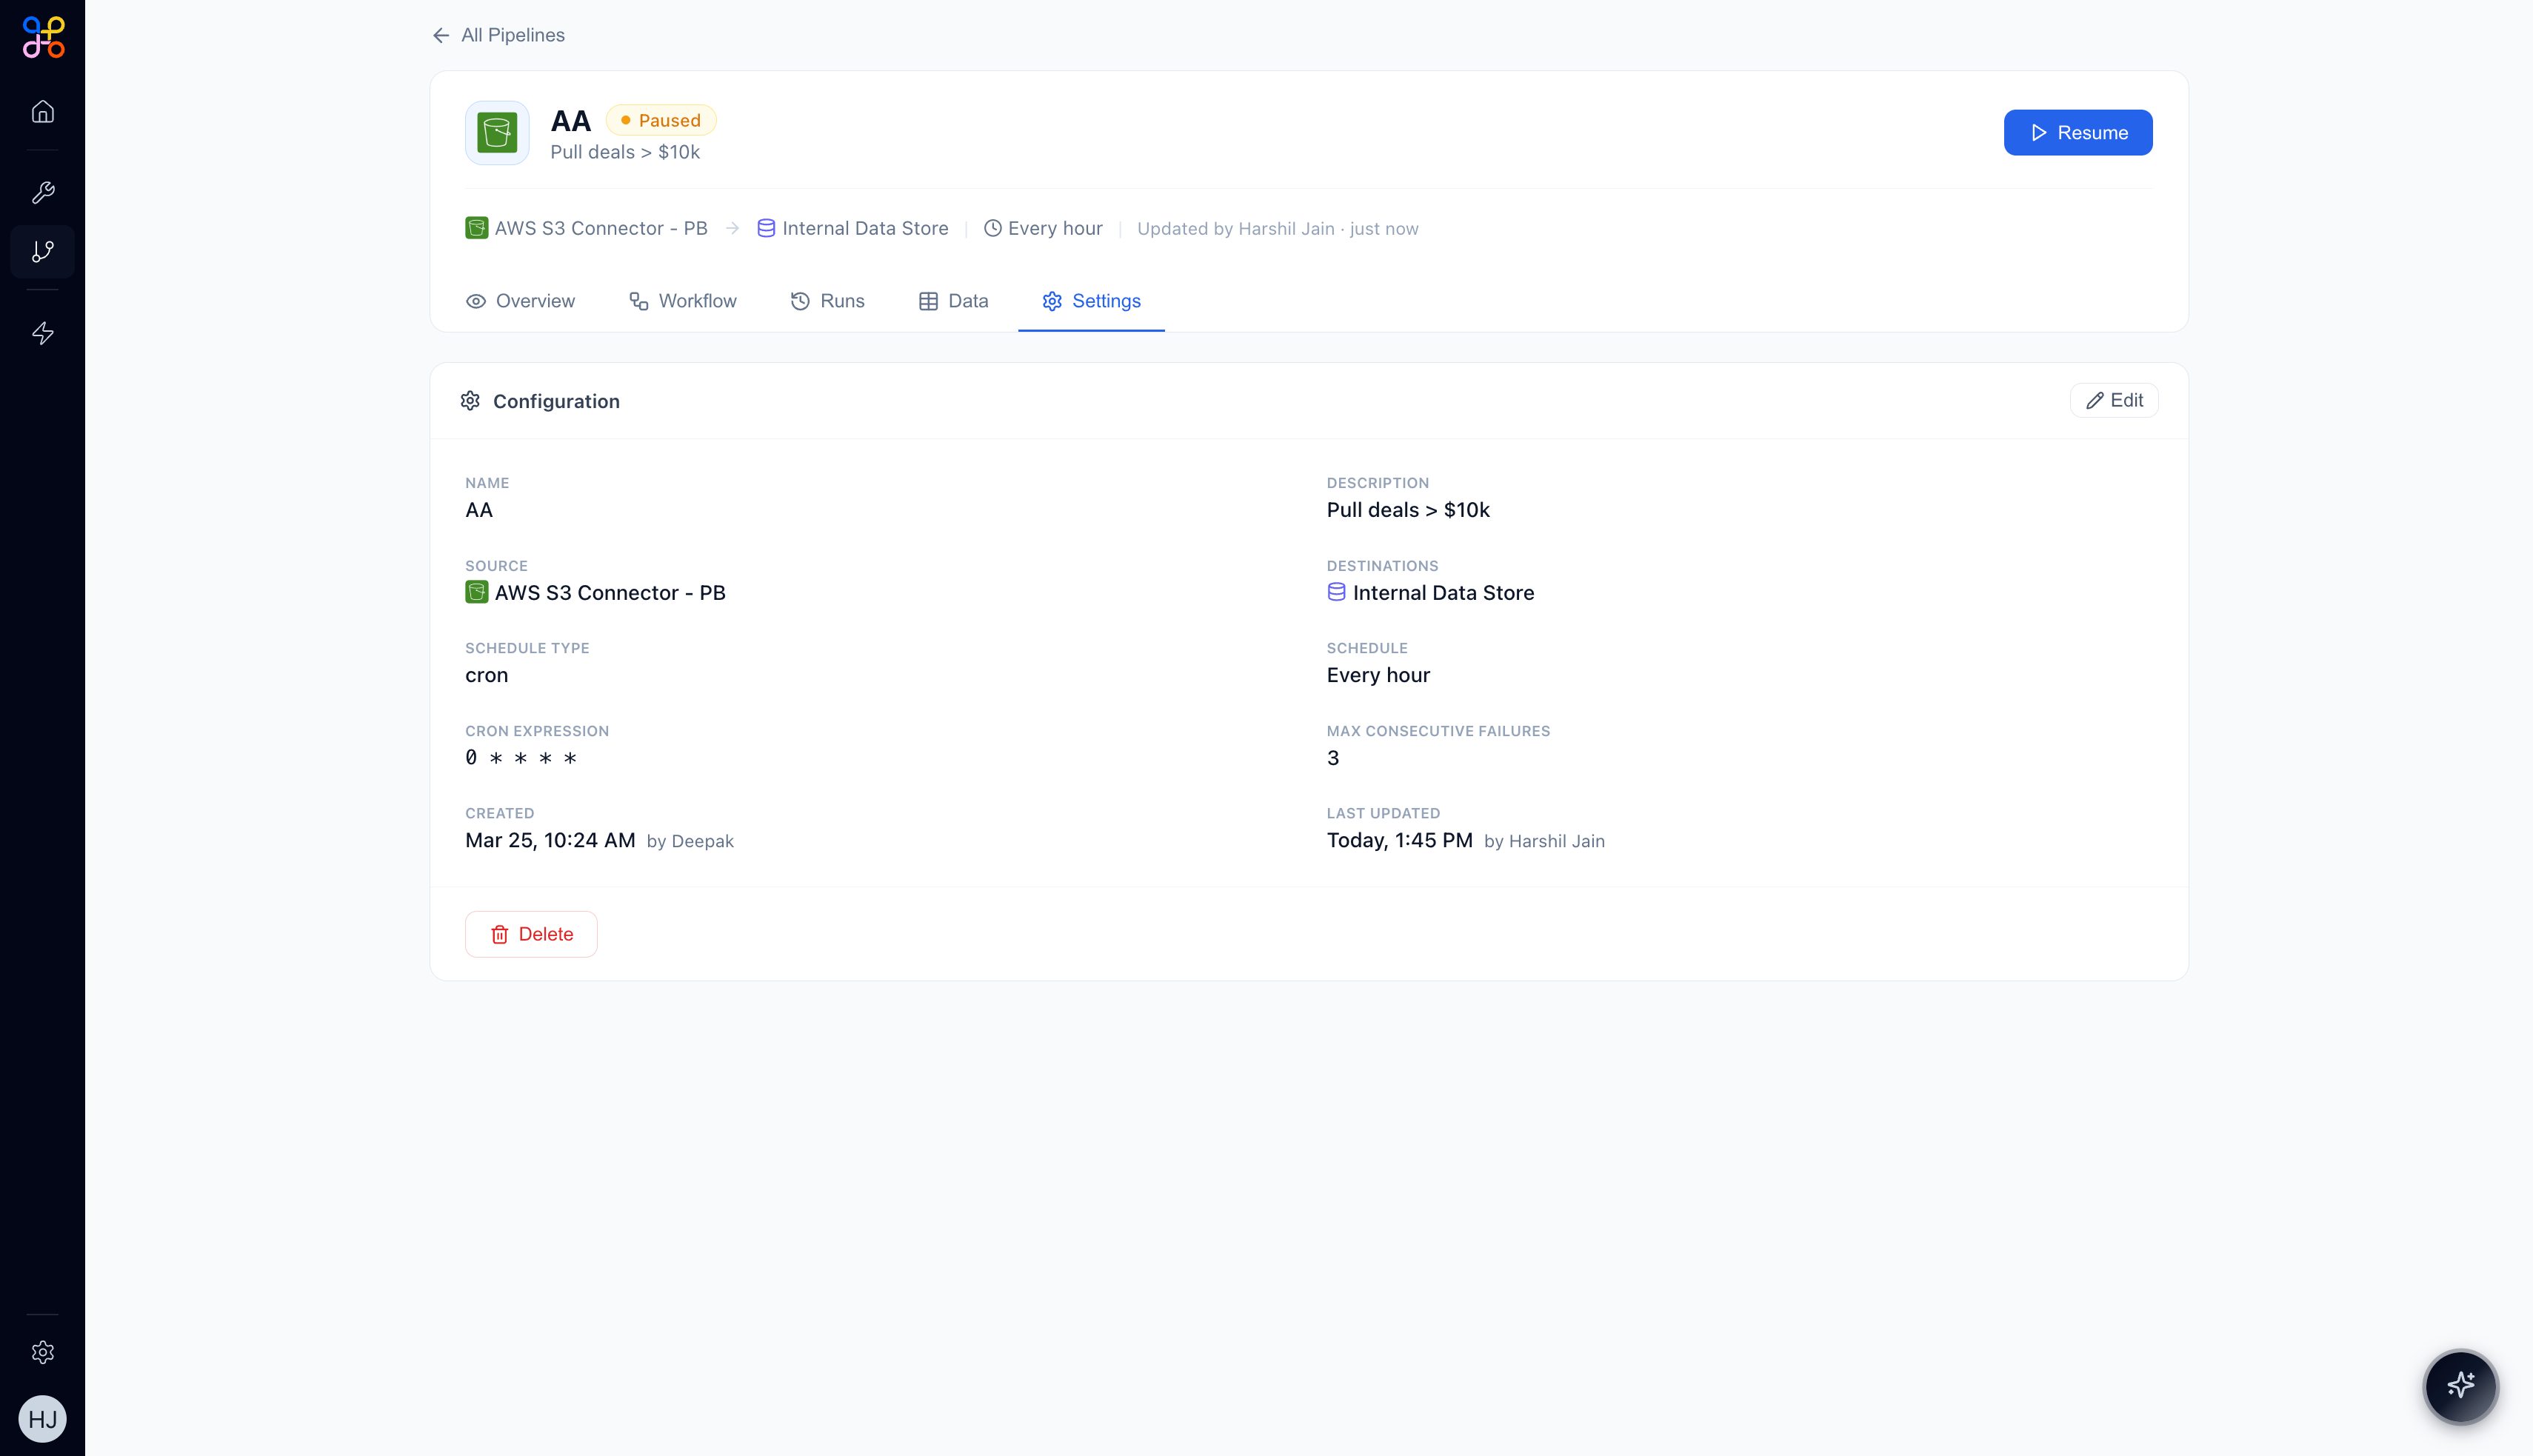
Configuration Fields
Auto-Pause on Failure
The Max Consecutive Failures setting (default: 3) automatically pauses the pipeline if it fails repeatedly. This prevents a misconfigured pipeline from silently running and producing bad data.Scheduling Options
Pipelines support five scheduling modes:The Pipelines Overview Dashboard
At the top level of the Pipelines section, the Overview tab shows aggregate health metrics across all pipelines in your project.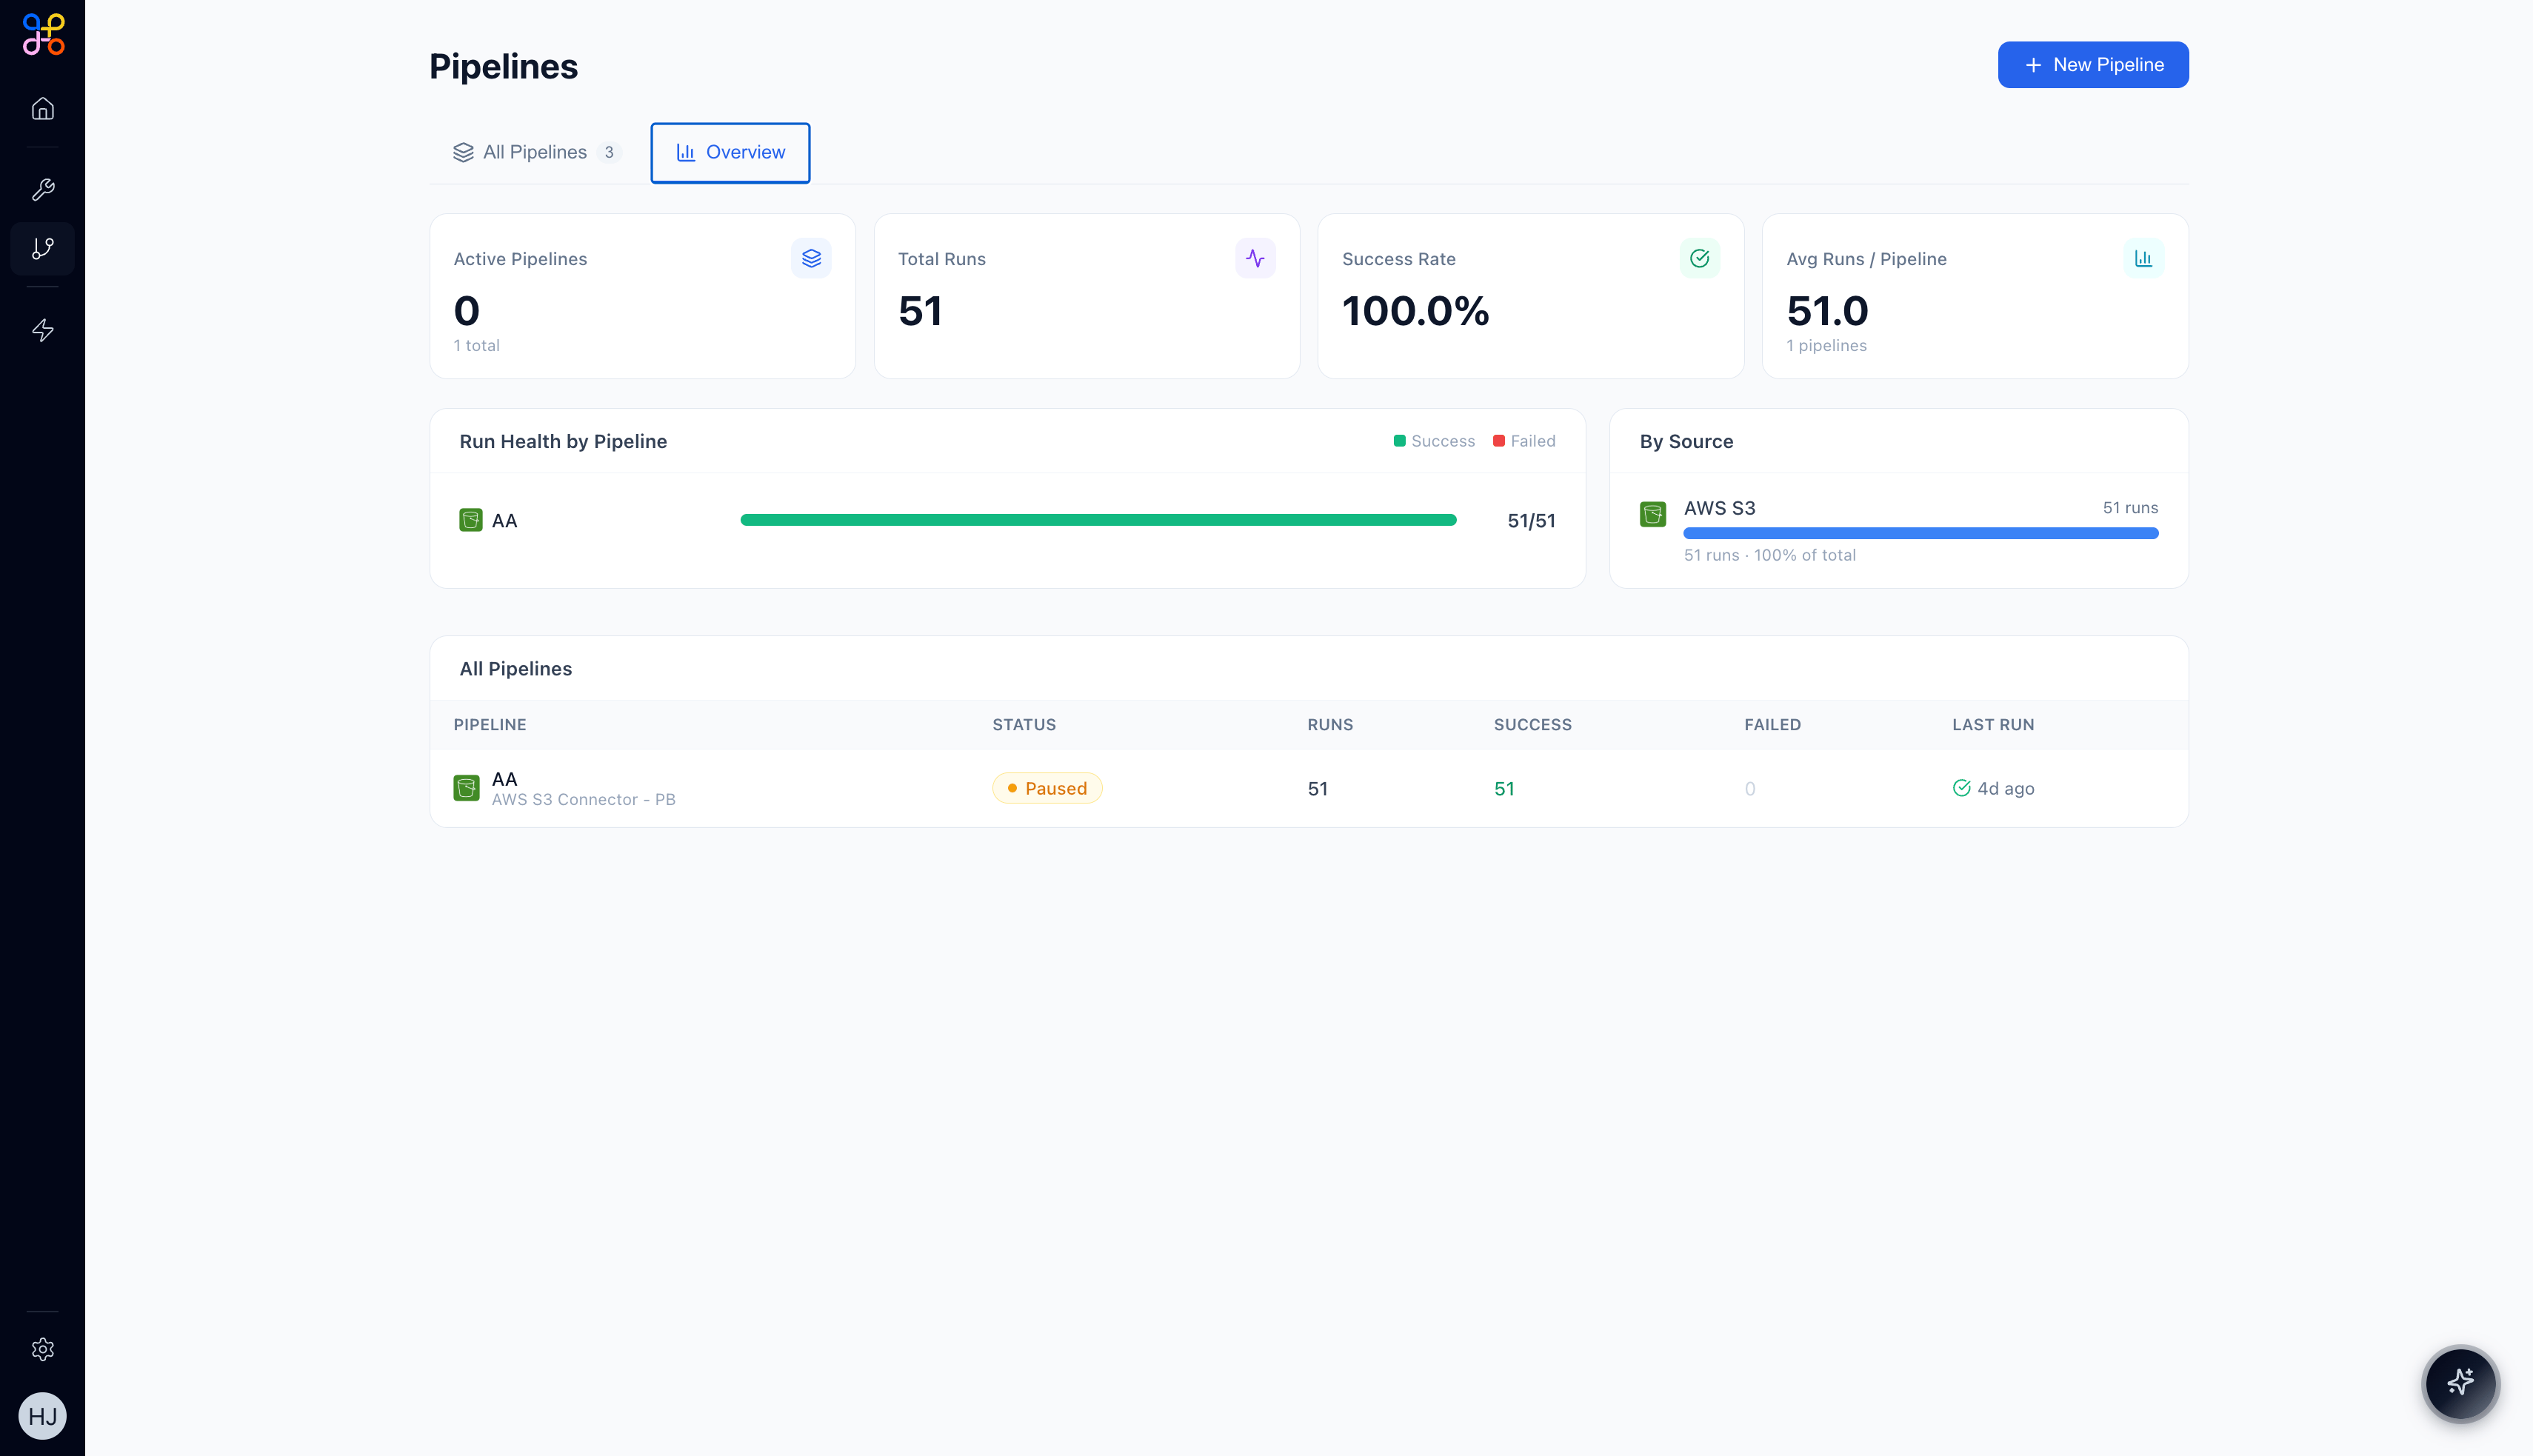
- Active Pipelines — how many are currently running (vs. total)
- Total Runs — all executions across all pipelines
- Success Rate — aggregate success percentage
- Avg Runs / Pipeline — average executions per pipeline
- Run Health by Pipeline — bar chart per pipeline showing success vs. failure ratio
- By Source — breakdown of runs by connector type
Next Steps
- Using Pipelines in Experiences — display Pipeline data in HITL dashboards
- Best Practices — tips for building reliable, maintainable pipelines