

The Runs view
The Runs view is the org-wide monitor for agent and pipeline runs — status, failures, and HITL, at a glance.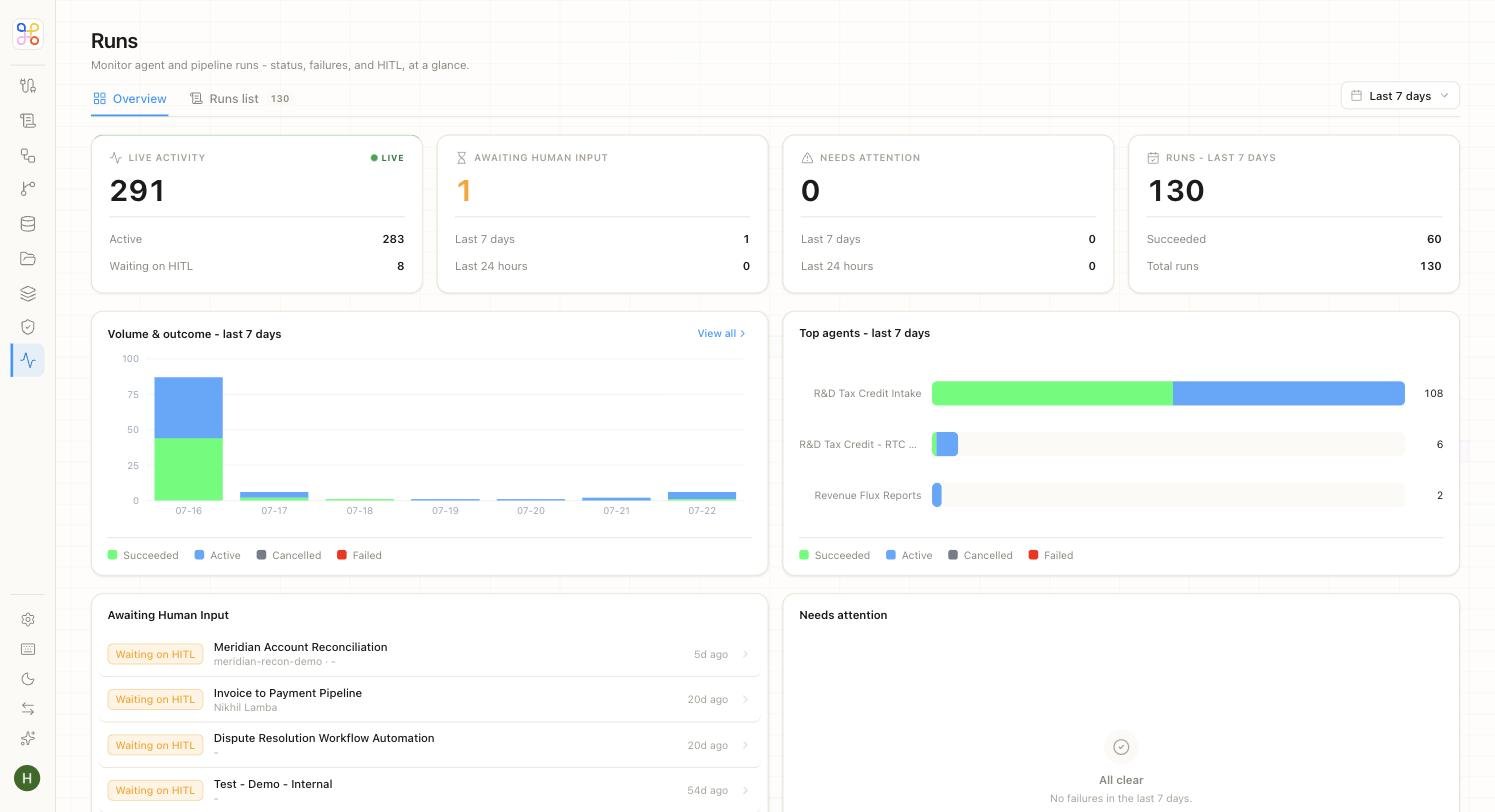
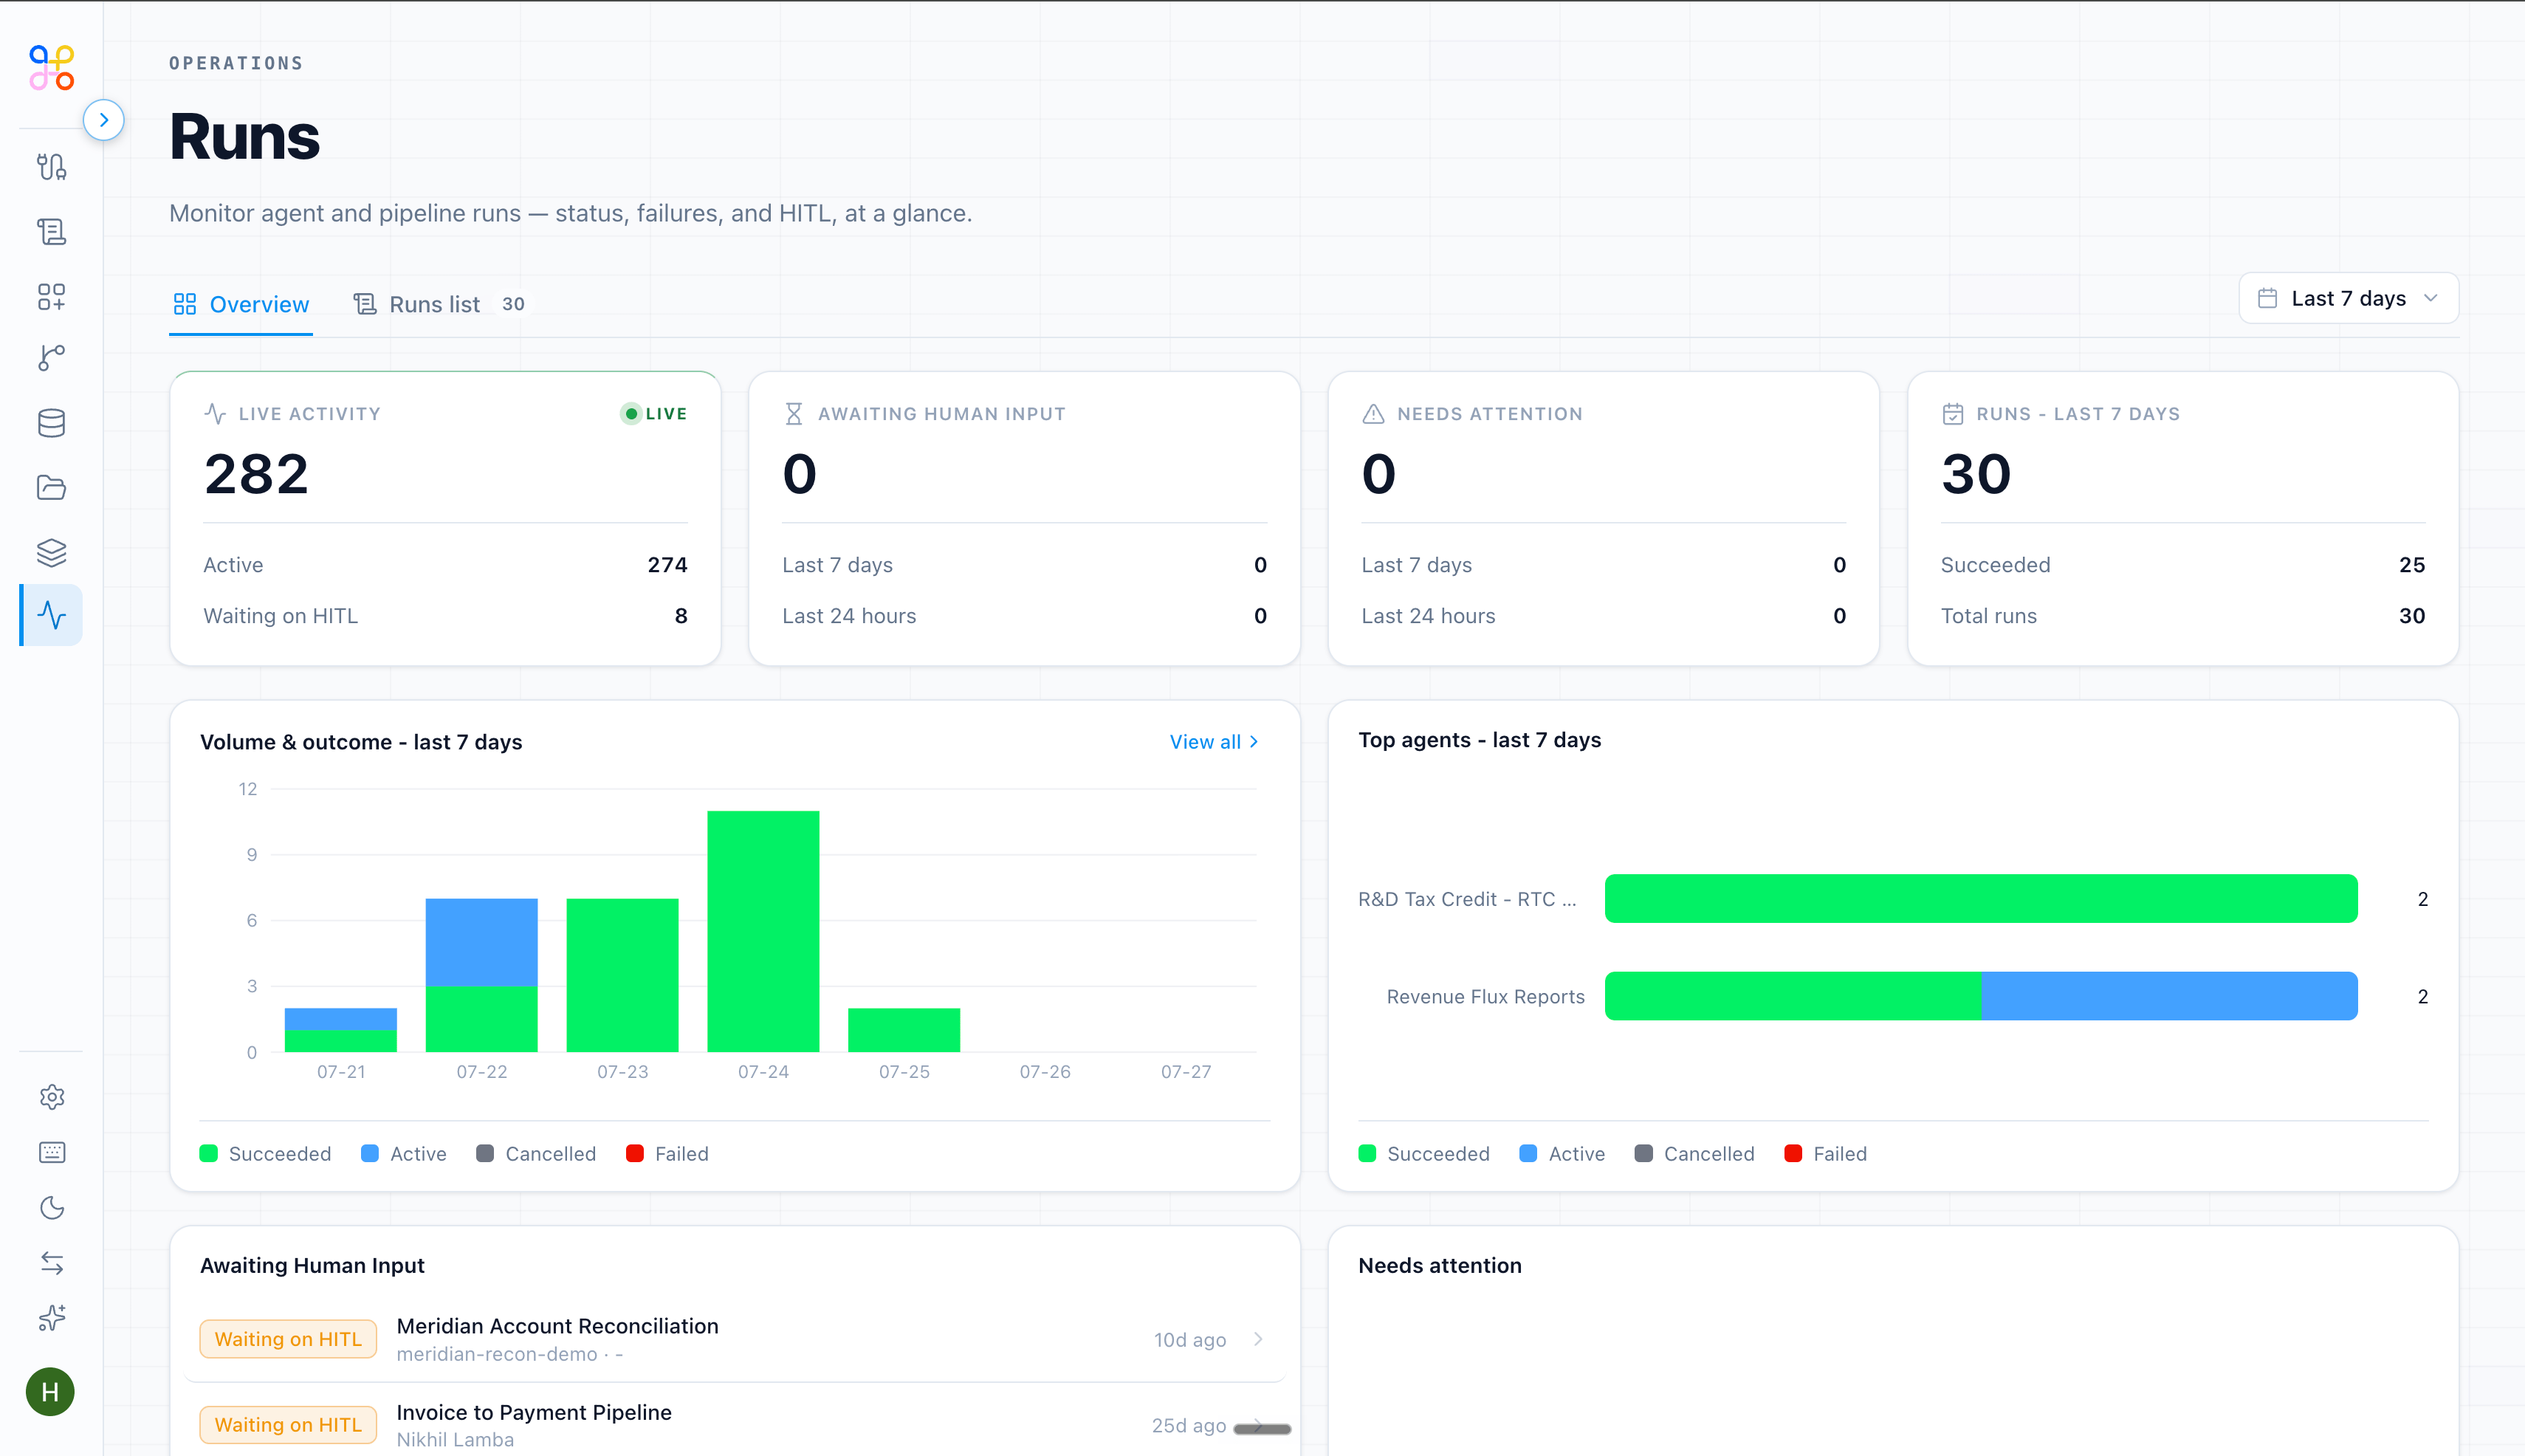
- Live activity — how many runs are active right now, and how many are waiting on HITL review.
- Awaiting human input — work paused for a reviewer, over the last 7 days and 24 hours.
- Needs attention — failures that need looking at.
- Runs (last 7 days) — total and succeeded.
Reporting
Reporting breaks down by process and by agent, so you can answer questions like “how much R&D work ran this quarter, and how much needed rework.” End users also get a self-service view of their own usage on their dashboard.Using the data
- If awaiting human input is growing, reviewers are the constraint — add or reassign them.
- If a specific agent shows a high failure rate, investigate its data source and instructions (see When a run fails).
- Use token trends to decide where BYOK or open-weight models would pay off (see Billing and credits).